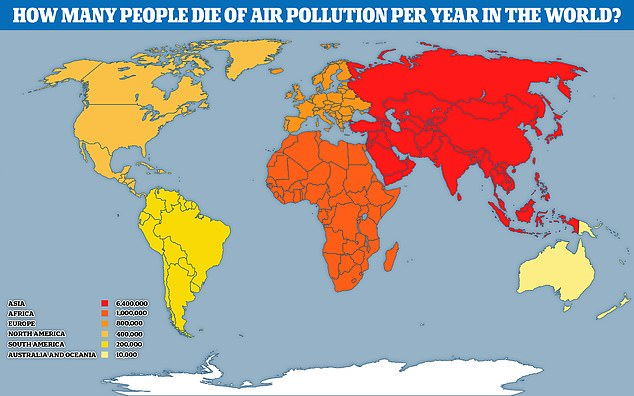
Air pollution is not only a major health risk, it also has damaging impacts on the environment and agricultural crop yields. These impacts have significant economic consequences, affecting economic growth as well as welfare. While existing laws and policies have made progress in reducing air pollution in specific regions, further action is needed to bring air quality to safe levels. For example, some of the highest recorded levels of air pollution are in Asia Pacific countries. 2.3 billion people in the region are exposed to levels of air pollution several times.
While the sources of these pollutants vary by country, they are linked to only a handful of activities. Urban and heavily industrialized areas with high population densities have the highest levels of air pollution. It is important for us to raise the awareness, but we also have to keep track of the risk too.
To get a better view on the danger that is right in front of us, to find a way how to stop it, we need to have somekind of a device/tool that can help us with using some important data about air pollution and it’s level of concentration in different areas. This isn’t a risk only in one specific region, this is a risk that is very-well know everywhere in the world, especially after Covid-19.
A lot of tools and devices have been made for this specific reason, for example the ESA TROPOMI NO2 map. Although we’re fascinated by it’s unique design and the way it works, our team was thrilled to hear that we have an opportunity to create something new. After gathering the members and working for the past few days, we believe we have THE TOOL for you! The International Air Observation Tool (IAOT). With the help of a lot of resources that were given from NASA, ESA, JAXA, we were able to come up with something interesting. The IAOT has the ability to calculate statistical information, hide/show plot specific plot variable, change the color and symbol for the variables, plot two datasets on the same time series plot. For example, we want to know more about Italy's air pollution before and after Covid-19. Just by using our tool, typing your country, you can get all of the data that you need (that includes a visualised map where we can tell which places have been mostly affected by air pollution, full data of which element is mostly concentrated in the atmosphere in that certain area, how much precentage of the territory is affected, differences between countries and so much more!). Even though some of these traits aren't currently available on our "demo website", we say in full confidence this is the tool that everyone would need for this certain information. It took us a lot of brainstorming to come up with something valuable and effective. We strongly believe that IAOT is the right tool for this challenge. With a lot more guidance and time the tool can be made perfectly and on point.
You can find more information about our tool from the integrated links in the Earth Observing Dashboard.