Awards & Nominations
SimpleAnimation has received the following awards and nominations. Way to go!


SimpleAnimation has received the following awards and nominations. Way to go!
The COVID-19 pandemic offered an unprecedented opportunity to look at changes in the Earth system in response to reduced human activity. Your challenge is to develop tools to better understand changes in the interconnected Earth system as seen through the EO Dashboard.
How did covid-induced changes in auto-exports affect local water quality in the ecologically important Ise Bay?Focusing on Nagoya Port and Ise Bay in Japan between November 2019 to present, our exploratory analysis correlates changes in auto-exports from COVID-19 to changes in water turbidity and chlorophyll-a content. Port Nagoya is the busiest port in Japan and where Toyota Motor Corporation exports most of its cars. Toyota reported a 16.9% decline in exports due to covid-19 and car activity in Port Nagoya declined by 0.61. Adding remote sensing-derived water quality measurements, we study how port water quality might change with decreased auto-exports.
Using this period of temporarily changed port activity, we hypothesize that if a reduction in the car/containers exported is observed during shutdown, then we should be able to observe reductions in total suspended matter and chlorophyll-A due to reduced industrial activities.
We think this is important because it’s hard to disentangle the marginal effects of increased exports of one economic sector. Covid-19 did not impact all sectors similarly so we wanted to study how declines in one sector might affect port water quality.
Through this analysis, we focus on two water quality metrics, water turbidity and chlorophyll-a content. Water turbidity is an optical characteristic of water, measured here by Total Suspended Matter concentration anomaly (%). Chlorophyll-a is the primary pigment for algae and cyanobacteria photosynthesis, measured here in chlorophyll-a concentration anomaly (%). It reveals the quantity of photosynthetic microorganisms within a given area. Water managers care about monitoring chlorophyll-a because increases in chlorophyll-a can indicate cyanobacteria and algal blooms. These algal blooms are harmful to aquatic environments as they deplete oxygen within a given water source and deprive sunlight from other aquatic plants. This results in ecosystem collapse forcing marine life to either leave the region or die.
Our tool takes user-input lockdown dates and outputs animations and images of true color and of water quality. Using the same user-input date range, our tool then outputs to average water quality and export anomalies during the specified lockdown period. While we only focused on Nagoya Port and Ise Bay, our algorithms for aggregating water quality data and generating animations of water quality and true color data are generalized and would allow other researchers to produce similar results for any area of their choosing.
We hope to connect the relationship between changes in auto exports with changes in port water quality.
Using data from the EO Dashboard, we were able to gut-check our hypothesis that there were changes in water quality in Ise Bay. However, as demonstrated in figure 1, below, we noticed that any changes from reduced port activity due to COVID-19 are only temporary.
Fig. 1 From left to right, images from EO Dash of Chlorophyll-a content. Images taken approximately year to date (2019-01-05, 2020-01-04, 2021-01-02)
How do you study complex problems? With Simple Animation
Using python in jupyter notebooks from the EDC importing Sentinel Hub API data, we accessed Sentinel-2 and Sentinel-3 imagery to create true color and water quality GIFs to explore temporal and spatial changes in these regions. GIFs are dynamic and, unlike static pictures, reveal changes over time in an accessible way.
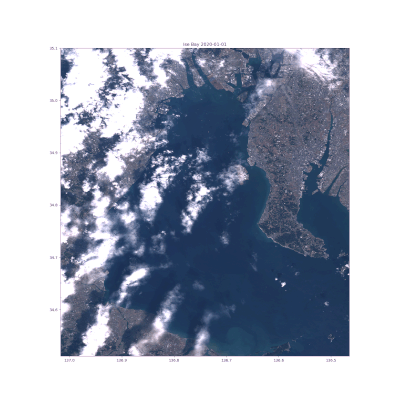
Figure 2. True Color Image scene from our gif of Ise Bay and Nagoya Port from our animation engine, processed in EDC, images from Sentinel-3.
While Japan’s government was not able to enforce a lockdown, we did chart the anomalies during the encouraged lockdown periods of lockdown #1 (March 25, 2020 to May 21, 2020) and lockdown #2 (July 2020 to present).
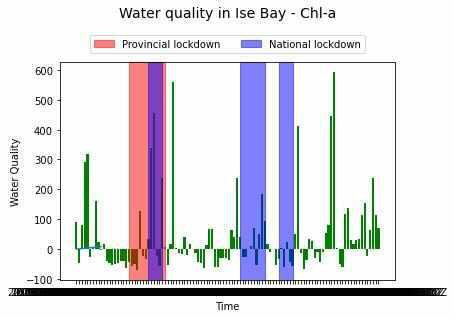
Figure 3. Charts the different periods of lockdowns in in Japan and Chlorophyll-a concentration from EO-Dash.
Finally, we connect JAXA-based changes (anomalies) in water quality to changes in car density changes in Nagoya Port.
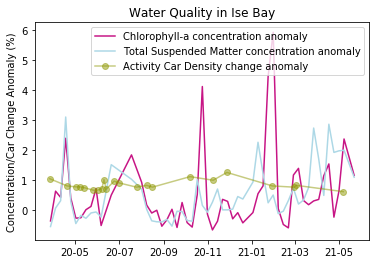
Figure 4. Shows anomalies of total suspended matter (TSM) and Chlorophyll-A concentrations during shutdown periods.
We used the following data sources:
Nagoya, Activity Car Density change in Nagoya Port is based on JAXA ALOS-2 satellite and the European Space Agency’s (ESA) Sentinel-1 satellite data.
Ise Bay Total Suspended Matter concentration anomaly (%) (link) and Ise Bay, Chl-a, Water Quality Time Series, Chlorophyll-a concentration anomaly (link) are from JAXA/EORC GCOM-C/SGLI sensor.
The true color gif and water quality animations were produced from Sentinel-2-L1C and Sentinel-3-OCLI imagery (link) via API calls in the European Data Cube. This is the data that we also use as our input for our raster analysis.
Citations are provided in the references section.
While we start this analysis focusing on Port Nagoya, these methods could be expanded upon and integrated into the EO Dashboard to study how temporary changes in imports and exports--or other data that we did not include in our analysis--impact port water quality.
We see two main contributions of this project that could be integrated into the EO Dashboard.
1) The animation engine. We have created a tool that generates GIFs of water quality and true color data for any region and over any time interval (within the limitations of Sentinel data) when provided with the relevant coordinates and dates. Water quality data are largely limited to only a few regions in the current EO Dashboard, and our solution could provide users with access to water quality data for any geographic are. Not only could they see more static images, but they could also easily generate animations that could be downloaded or embedded.
2) Data analysis. We generated summary statistics for our study region and performed basic statistical analysis. Our team plotted the differences and briefly examined the mathematical correlation, where possible, between water quality (sediment, chlorophyll, and turbidity), car mobility data, and lockdown dates. To do so, we only used open source software (python) and publicly-accessible data so that our algorithms could be easily folded into the existing EO Dashboard. One major limitation we faced was difficulties in accessing the data behind the imagery. Not only would these data make our analysis stronger but are also confident that--if provided the opportunity to work with space agency experts--we could improve upon the dashboard and existing API to provide users with access to raw data numerical data in addition to imagery.
Our approach relied on scripts available from EDC tutorials. We have liked a repository with the code we used below.
Corporation., T. M. (2021, June 10). Toyota’s 2020 Global Sales down 10.5 Percent Year-on-Year | Sales, Production, and Export Results | Profile | Company. Toyota Motor Corporation Official Global Website. https://global.toyota/en/company/profile/production-sales-figures/202012.html
Port of Nagoya. (n.d.). World Port Source. Retrieved June 30, 2021, from http://www.worldportsource.com/ports/commerce/JPN_Port_of_Nagoya_1382.php
Sentinel-2 L1C. (n.d.). Sentinelhub. Retrieved June 30, 2021, from https://docs.sentinel-hub.com/api/latest/data/sentinel-2-l1c/
Sentinel-3 OLCI L1B. (n.d.). Sentinelhub. Retrieved June 30, 2021, from https://docs.sentinel-hub.com/api/latest/data/sentinel-3-olci-l1b/
Top ten ports - FVL European ports 2020. (2020, May 14). Automotivelogistics Digital. https://automotivelogistics.h5mag.com/fvl_european_ports_2020/top_ten_ports
COVID-19 Community Mobility Report. (n.d.). COVID-19 Community Mobility Report. Retrieved June 29, 2021, from https://www.google.com/covid19/mobility?hl=en
#gif #water_quality #port #shipping #jaxa #esa
This project has been submitted for consideration during the Judging process.
