Awards & Nominations
God's Eye has received the following awards and nominations. Way to go!


God's Eye has received the following awards and nominations. Way to go!
The EO Dashboard is derived from a suite of different satellites from the EO observation (EO) programs of the three collaborating space agencies: NASA, ESA, and JAXA. Your challenge is to devise a way to visually fuse information from diverse Earth observation datasets of different missions.
Objective is to devise a way to visually fuse information from diverse Earth observation datasets of different missions into a single user freindly application.Multi Mission Earth observation layers are merged into a single interactive application enabling users to explore the various earth observations at same platform rather than exploring the same at various other portals as separate.This project is an interesting compilation of various Earth Observations in real time which is supported by various datasets published by NASA/JAXA/ESA/ESRI in public domain enabling a scope of exploration for Global community of science enthusiastics.Also fused with information of natural disasters info.
What did you develop?
We as a team "God's Eye" has selected the challenge "Interactive Data Exploration" and thought of to create a "Multi Mission Earth observation" app by using various datasets merged into a single application with focus on 360 degree visualization on various aspects of Earth observations inclusive of real time interpretation of Natural disasters and change in climatic conditions as well.
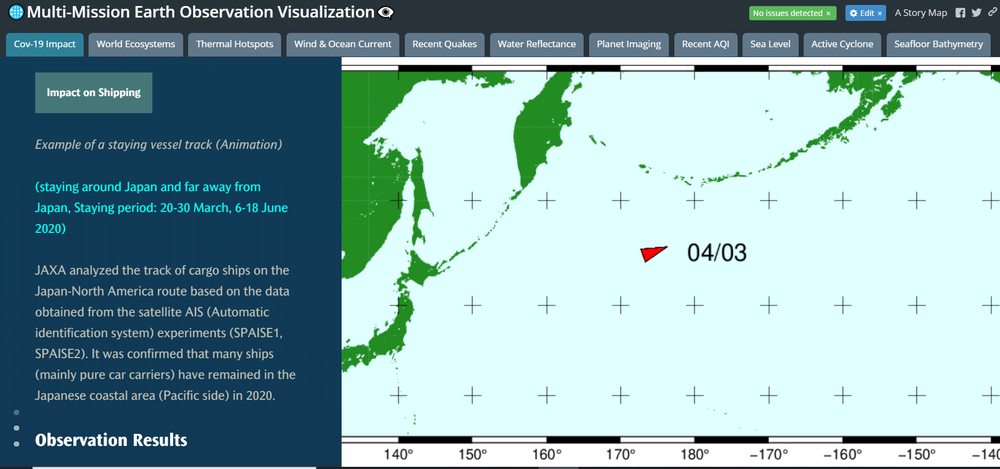
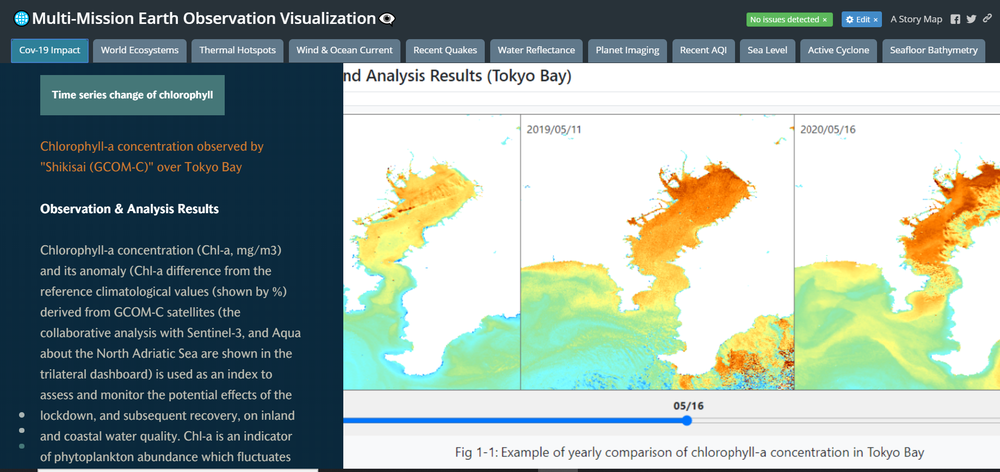
Overall Covid-19 Impact is also shown especially on shipping industry and on our environment as well.
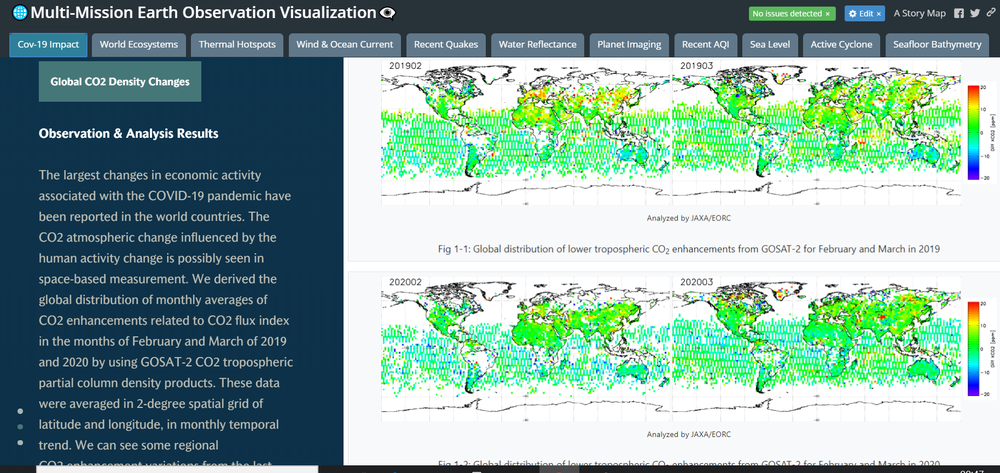
Emphasis on Topics such as Green House Gases, Water Quality, CO2 Emission etc.
Why is it important?
Importance is given towards the health of planet Earth by demonstrating various changes/Impact on Earth due to Carbon/Human Footprints. Study of these devastating impact may draw everybody's attention to save our planet.
What does it do?
This indigenous app is able to depict true picture of various Earth Observation models in real time duly supported by the real time databases published in public domain by NASA/JAXA/ESA/ESRI. Natural disasters such as Earthquakes, Increased Sea Levels, Active Cyclones can be easily monitored and also visualize the possible affected areas and other alerts as well.
This may play a great role towards public safety and self awareness about knowing planet Earth.
How does it work?
You need to just click on the links provided for various datasets and it will sync in real time and reflect the current positioning/picture of the desired query. Easy navigation by Zoom in & Zoom out feature duly threaded by current information captured by various satellites.
What do you hope to achieve?
We hope our small effort towards the creation of this app may encourage students and science enthusiastics to focus more on our Planet Earth and contribute every possible effort with a view to safeguard the same in best possible manner.
What inspired your team to choose this challenge?
Entire Globe is suffocating from the impact of Covid-19, and due to this our Planet Earth has also witnessed the changes in multiple aspects at broader level. Our team's whole idea was to showcase the change to all civilians in a user friendly manner so that they may understand the complex Earth mechanism in much simplest forms.
This app is for every user who possess the basic interest to know about Earth and willing to explore/contribute about Earth.
What was your approach to developing this project?
The very first approach was to gather all relevant information about Earth metabolism from various datasets.
Major focus was on compilation of all these datasets into a single platform. Simultaneously all maps were being configured with multi key indicators related to Earth observations. All these are visible in form of legends while navigating to the pages enclosed.
What tools, coding languages, hardware, software did you use to develop your project?
Javascript API's has been put in use to fetch real time information from servers.
GIS mapping feature has been used for Geo mapping and Geodata based output on ARCGIS ONLINE platform supported by ESRI.
JAXA for Earth datasets has been used to depict the changes due to Covid-19 impact.
This project is developed on ARCGIS ONLINE platform supported by ESRI. References of Various Earth Observation datasets are taken from data available in public domain published by NASA/JAXA/ESA/ESRI.
Various Earth Observation datasets are explored and also active use of NASA softwares has been taken into consideration such as
2) FIRMS
3) Worldview
4) Earthdata
What problems and achievements did your team have?
Able to demonstrate the project via the link https://arcg.is/Xneau but unable to save the support files on Github as this is developed on ARCGIS ONLINE platform supported by ESRI which doesn't allow to share the data to other channels.
Achievements:
Lots of efforts has been made towards testing of the real time output information, which our team is confident to bet on as the application syncs with real time data in appropriate manner and true as per our knowledge.
We have explored various layers related to "Multi Mission Earth Observations" and multiple journals published by NASA in public domain and worked on 10 different layers to fuse all of them into a single interactive application so that users may find it informative and can be referred as study material for science enthusiastics.
A visualization has been also created to show the overall impact due to Covid-19 through a sample dataset published by JAXA pertaining to lockdown periods enabling all of us to understand the Time series change on topics listed below.
a) Impact on Shipping
b) Green House Gases
c) Water Quality change
Geodata based output visualizations on above parameters are as follows:
Project Demo:https://arcg.is/Xneau
Earth Observation Layers:
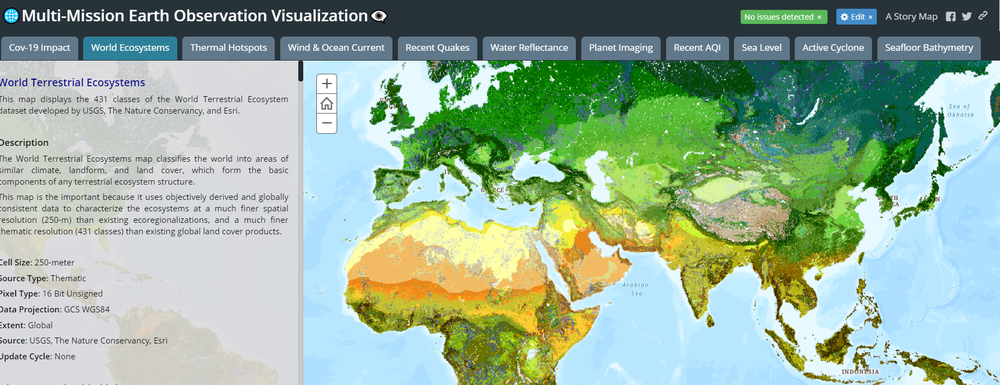
1) World Terrestrial Ecosystems -->
https://rajansingh5264.maps.arcgis.com/home/item.html?id=91149d0ad1e746e4b90f8ace8e186bf6
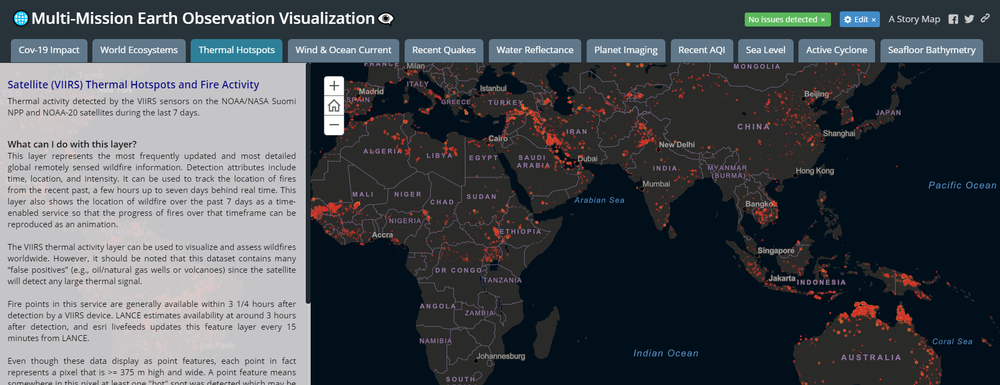
2) Satellite (VIIRS) Thermal Hotspots and Fire Activity-->
https://rajansingh5264.maps.arcgis.com/home/item.html?id=0f9cc92e1a934076b452cd48d5d7d55e
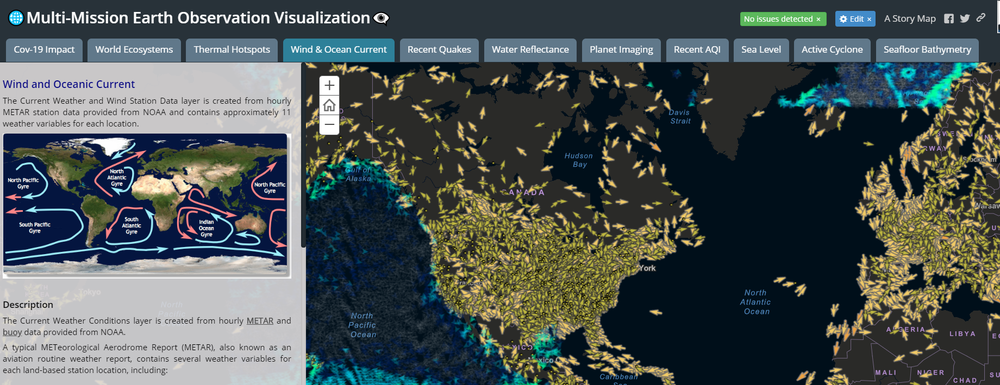
3) Wind and Oceanic Current -->
https://rajansingh5264.maps.arcgis.com/home/item.html?id=c6316b77093344ffbeed0cf6fcd92683
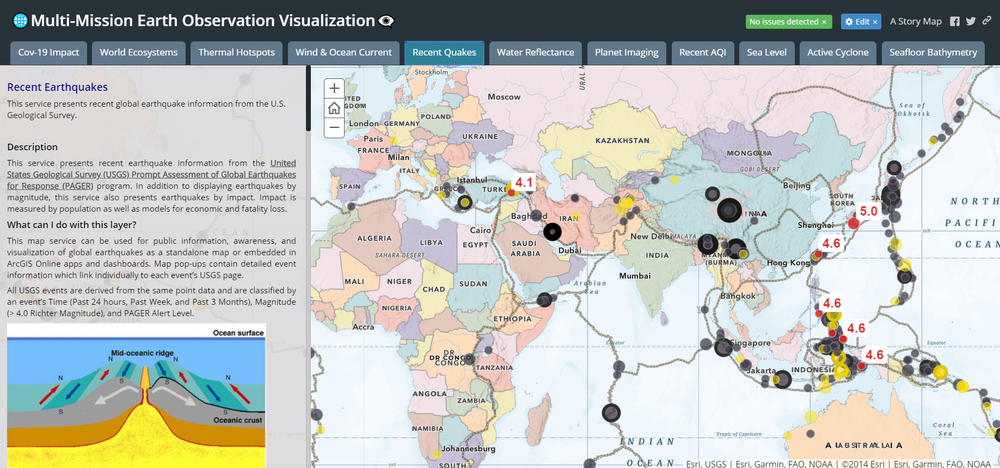
4) Recent Earthquakes -->
https://rajansingh5264.maps.arcgis.com/home/item.html?id=bdfd2e8262384f2e9d235d2831bb4902
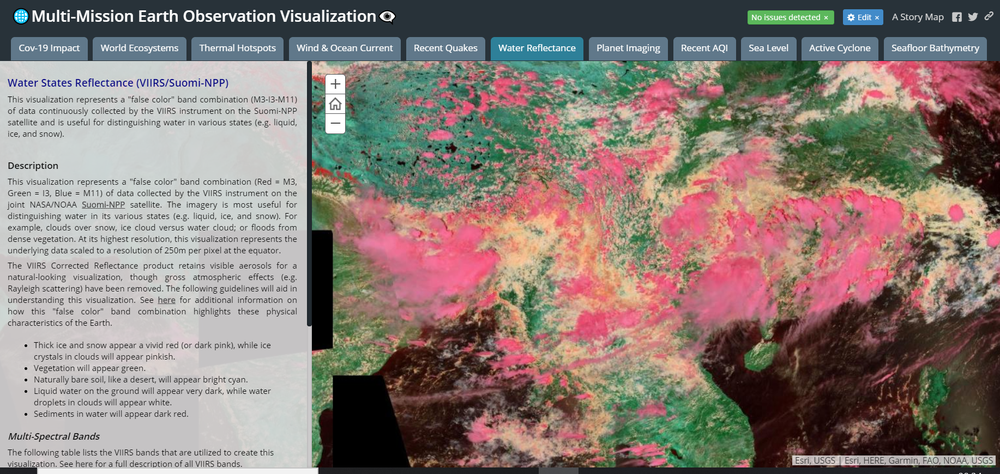
5) Water States Reflectance (VIIRS/Suomi-NPP) -->
https://rajansingh5264.maps.arcgis.com/home/item.html?id=08bc972eb2a84573b5e51b96b4af2c1b
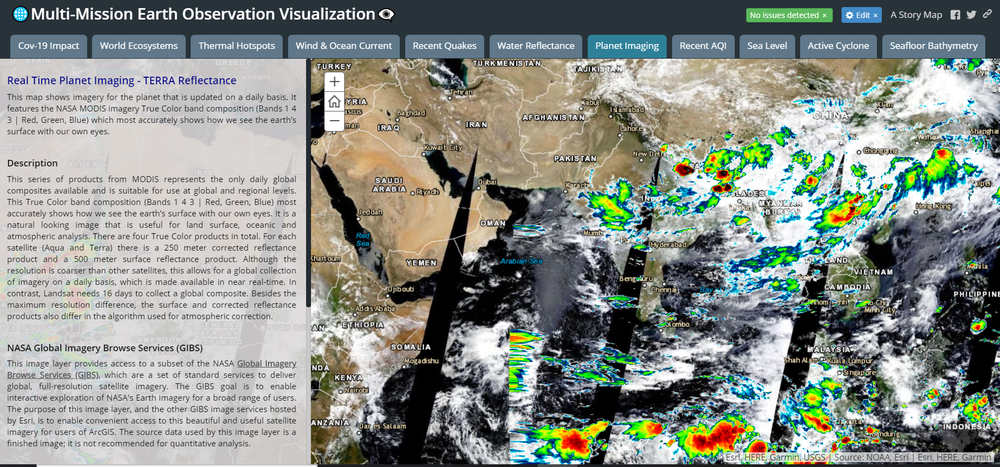
6) Real Time Planet Imaging - TERRA Reflectance -->
https://rajansingh5264.maps.arcgis.com/home/item.html?id=823188a18a3e4044a291f2f12b4ef5de
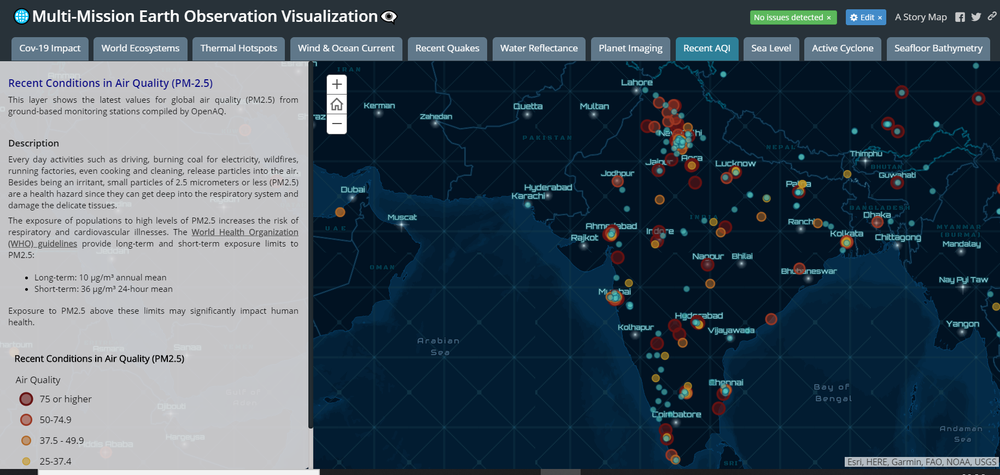
7) Recent Conditions in Air Quality (PM-2.5) -->
https://rajansingh5264.maps.arcgis.com/home/item.html?id=7983b6ba6bbf420690db16cb79a77a6e
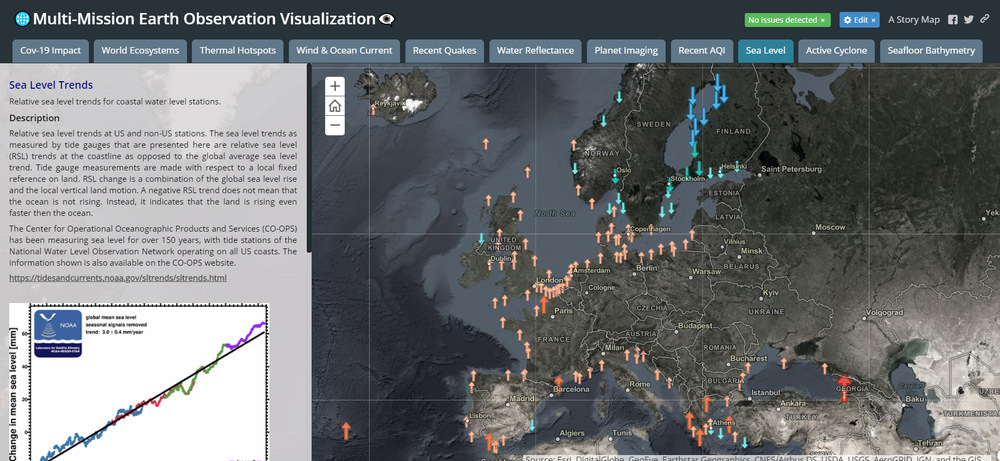
8) Sea Level Trends -->
https://rajansingh5264.maps.arcgis.com/home/item.html?id=a0ce2a6edfd64bb7bbe2f2e04be22215
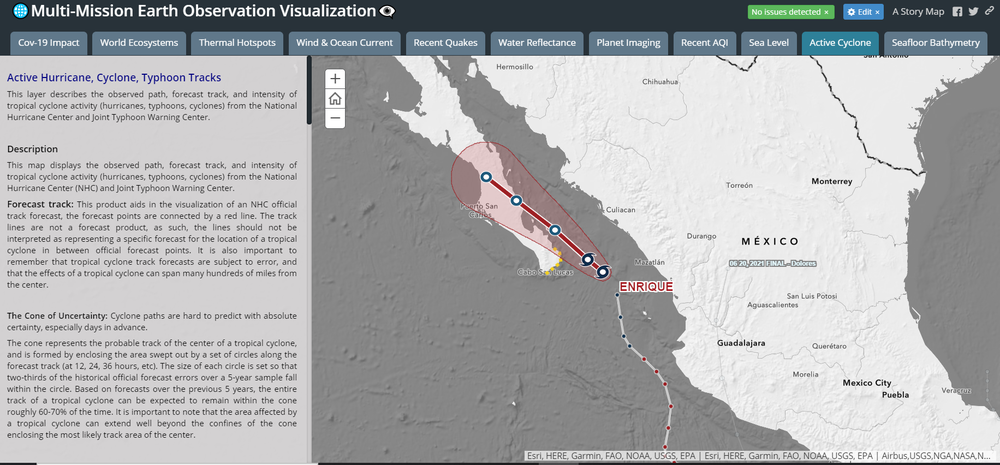
9) Active Hurricane, Cyclone, Typhoon Tracks -->
https://rajansingh5264.maps.arcgis.com/home/item.html?id=d4c5c2f2609d4e51a83712a5781fedda
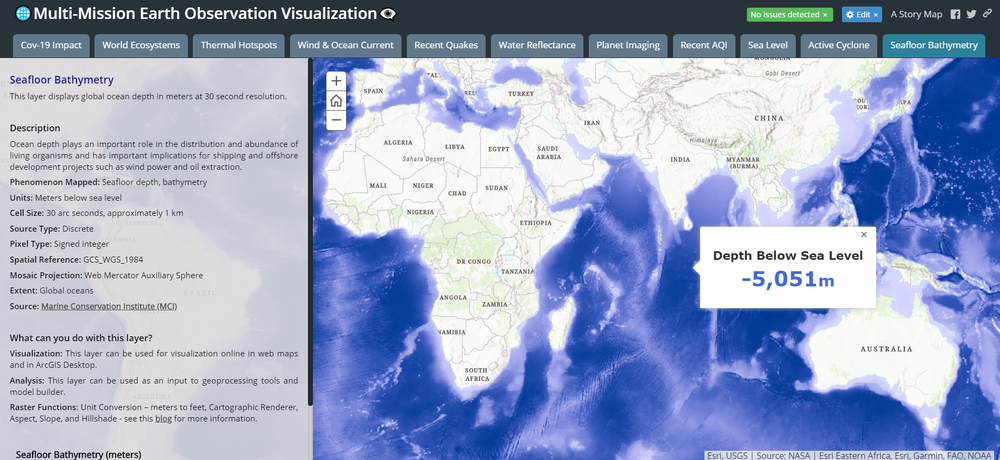
10) Seafloor Bathymetry -->
https://rajansingh5264.maps.arcgis.com/home/item.html?id=aabd06c5f88443d297702e83f669061a#overview
Given below data resources/abstracts/journals/maps has been explored in order to establish a Javascript API to fetch the real time information captured from various Earth Observation satellites.
The data is parsed through a ARCGIS feature server and configured in form of an app which is able to provide click based real time info duly synced with Geo data at a very macro level.
Since our project is based on Multi Mission Earth data hence we explored various datasets available on https://earthdata.nasa.gov/ and fused them into a single application with the relevant information of particular map alongwith its legend info.
Data sources as mentioned below:
Earth Observation Layers:
1) World Terrestrial Ecosystems --> This map displays the 431 classes of the World Terrestrial Ecosystem dataset developed by USGS, The Nature Conservancy, and Esri.
Data Sources:
https://cce.nasa.gov/terrestrial_ecology/
https://science.nasa.gov/earth-science/focus-areas/carbon-cycle-and-ecosystems
2) Satellite (VIIRS) Thermal Hotspots and Fire Activity --> Thermal activity detected by the VIIRS sensors on the NOAA/NASA Suomi NPP and NOAA-20 satellites during the last 7 days.
Data Sources:
https://earthdata.nasa.gov/earth-observation-data/near-real-time/firms/active-fire-data
https://firms.modaps.eosdis.nasa.gov/
3) Wind and Oceanic Current --> The Current Weather and Wind Station Data layer is created from hourly METAR station data provided from NOAA and contains approximately 11 weather variables for each location.
Data Sources:
https://oceanservice.noaa.gov/
https://www.noaa.gov/education/resource-collections/ocean-coasts/ocean-currents
https://oceantracks.org/library/oceanographic-factors/ocean-currents
https://www.ncdc.noaa.gov/data-access/land-based-station-data
4) Recent Earthquakes --> This service presents recent global earthquake information from the U.S. Geological Survey.
Data Sources:
https://appliedsciences.nasa.gov/what-we-do/disasters/earthquakes
https://earthobservatory.nasa.gov/topic/earthquakes
https://www.jpl.nasa.gov/topics/-earthquakes
https://www.usgs.gov/natural-hazards/earthquake-hazards/earthquakes
5) Water States Reflectance (VIIRS/Suomi-NPP) --> This visualization represents a "false color" band combination (M3-I3-M11) of data collected by the VIIRS instrument on the Suomi-NPP satellite and is useful for distinguishing water in various states (e.g. liquid, ice, and snow).
Data Sources:
https://earthdata.nasa.gov/eosdis/science-system-description/eosdis-components/gibs
https://earthdata.nasa.gov/collaborate/open-data-services-and-software/api/gibs-api
https://earthdata.nasa.gov/worldview
6) Real Time Planet Imaging - TERRA Reflectance --> This map shows imagery for the planet that is updated on a daily basis. It features the NASA MODIS imagery True Color band composition (Bands 1 4 3 | Red, Green, Blue) which most accurately shows how we see the earth’s surface with our own eyes.
Data Sources:
https://lpdaac.usgs.gov/products/mod09a1v006/
https://modis.gsfc.nasa.gov/data/dataprod/mod09.php
https://www.arcgis.com/home/item.html?id=600fdf2448324acbbf34520ae734b8ed
https://worldview.earthdata.nasa.gov/
7) Recent Conditions in Air Quality (PM-2.5) --> This layer shows the latest values for global air quality (PM2.5) from ground-based monitoring stations compiled by OpenAQ.
Data Sources:
https://earthdata.nasa.gov/learn/pathfinders/health-and-air-quality-data-pathfinder
https://earthdata.nasa.gov/earth-observation-data/near-real-time/hazards-and-disasters/air-quality
https://sedac.ciesin.columbia.edu/data/set/sdei-global-annual-gwr-pm2-5-modis-misr-seawifs-aod
8) Sea Level Trends --> Relative sea level trends for coastal water level stations.
Data Sources:
https://tidesandcurrents.noaa.gov/sltrends/
https://climate.nasa.gov/vital-signs/sea-level/
9) Active Hurricane, Cyclone, Typhoon Tracks --> This layer describes the observed path, forecast track, and intensity of tropical cyclone activity (hurricanes, typhoons, cyclones) from the National Hurricane Center and Joint Typhoon Warning Center.
Data Sources:
https://mynasadata.larc.nasa.gov/basic-page/hurricane-dynamics
10) Seafloor Bathymetry --> This layer displays global ocean depth in meters at 30 second resolution.
Data Sources:
https://oceanservice.noaa.gov/facts/bathymetry.html
https://www.arcgis.com/home/item.html?id=3e20c8ae23b44ca7b99af621fdc129de
Earth Observation, Multi Mission Earth Observations, Interactive Data Application, Natural Disaster
This project has been submitted for consideration during the Judging process.