Errors on R no surprise there so we consorted to Excel for a simplier and faster approach.
Team Updates
Developing a way to map this by dates.
We also need to figure out to code the iframe to the documentation tomorrow and experiment on it a bit on the embed map on EO dashboard.
Downloading all the necessary files into the computer. I will show a visualization later...
The data of these urban areas is our primary target for now and later we can document.
target 1. Show data output both VIIRS and CO2
target 2. Documentation
target 3. Video or slides presentation?
target 4. goto canva and make infographics
So we decided to compare the cities mobility and air pollution on how it affected during times of pandemic. Downloading data now...
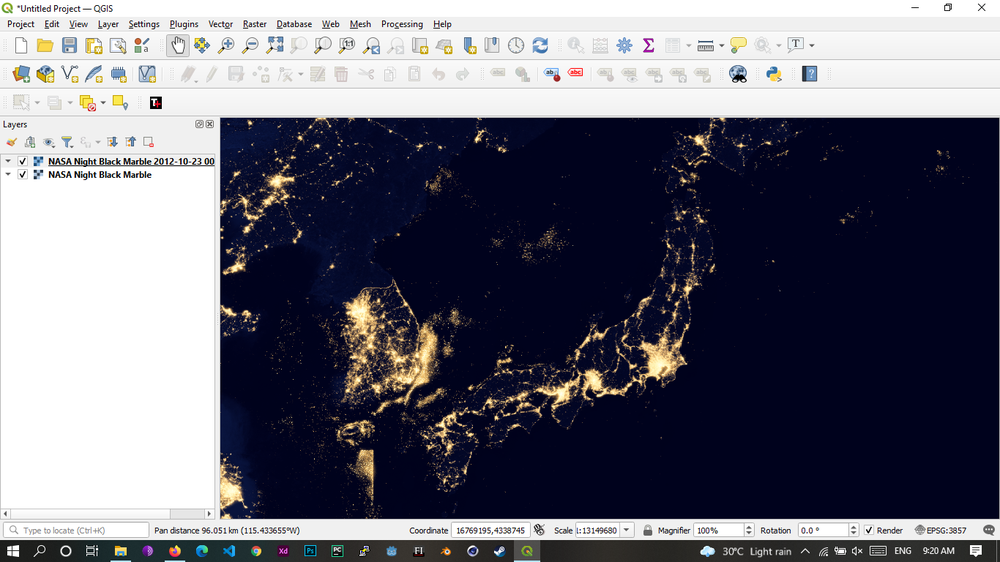
Installing QGIS for VIIRS
Researching the data from LAADS DAAC and EO Dashboard on the cities of Wuhan, Beijing, and Chongqing.