Research result
Finding Issues
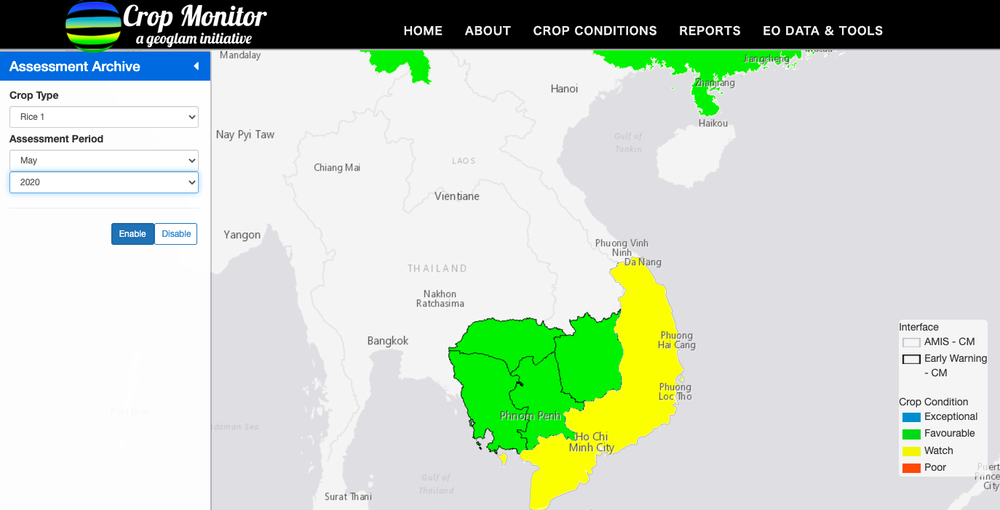
In May and June 2020, there was a sudden crop failure of Thai rice in the lower reaches of the Mekong River.
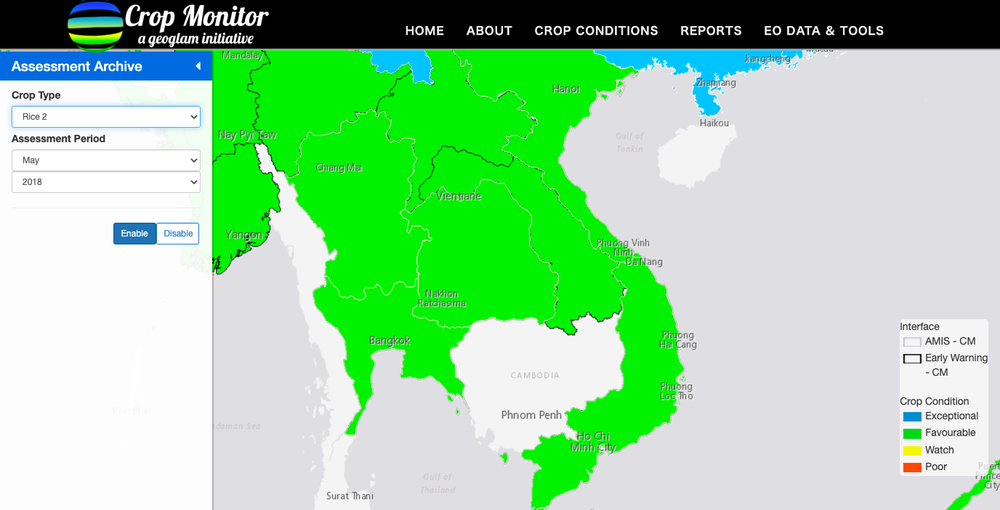
May 2019 is good (Rice1 (Japanese rice) AVERAGE Rice2 (Thai rice) AVERAGE)
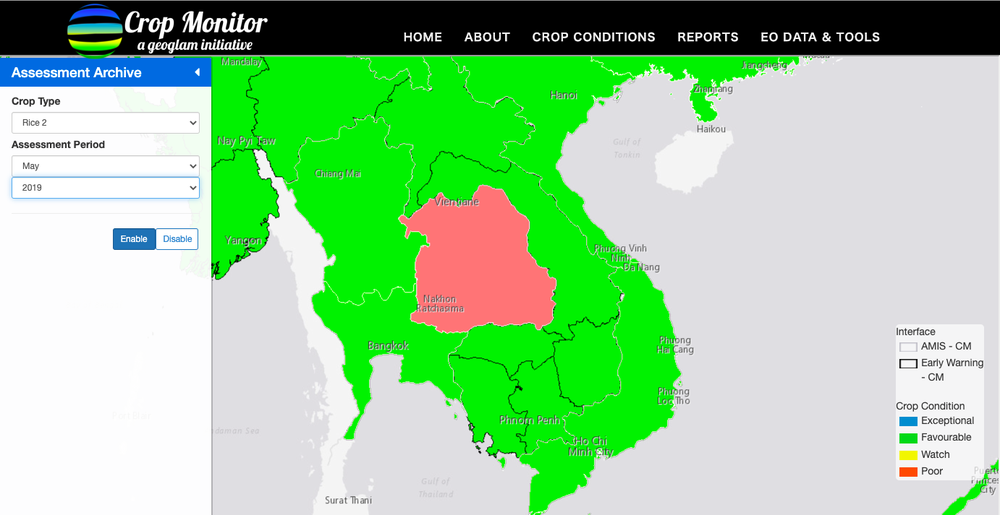
May 2020 is bad (especially Thai rice(THAI RICE), not Japanese rice)
 o
o
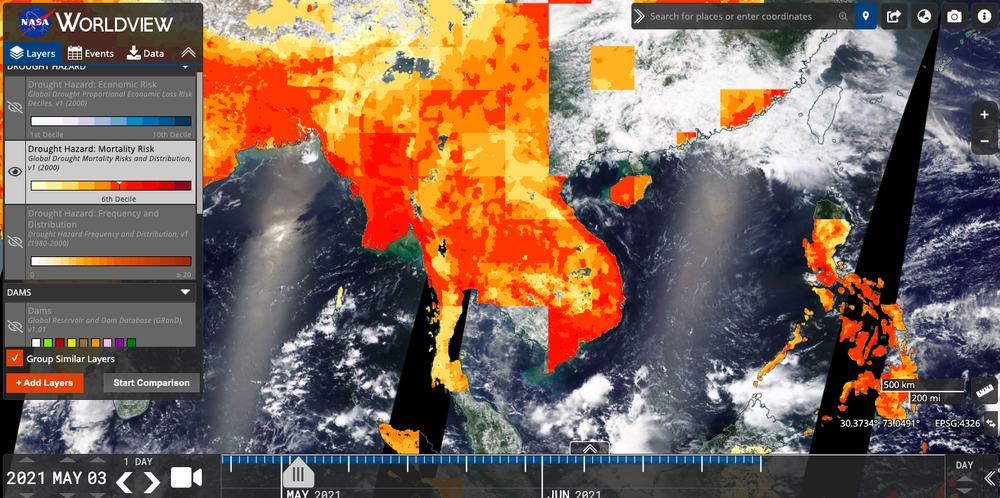
Poor Thai rice condition in downstream in May 2021 (especially Thai rice, not Japanese rice)
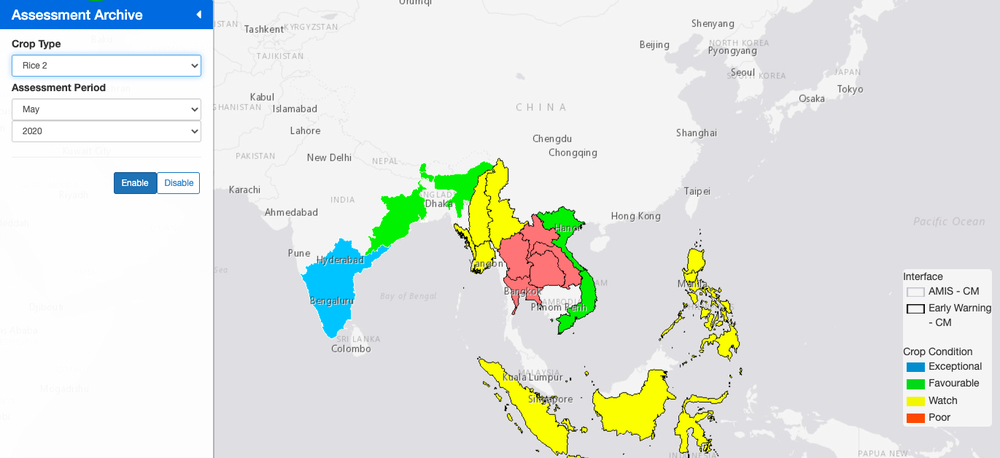
Global Impacet on Rice2 Thai Rice
https://cropmonitor.org/index.php/eodatatools/cmet/
Cause:
It is possible that the dam construction is progressing upstream of the Mekong River and the water level of the river has decreased due to the dam.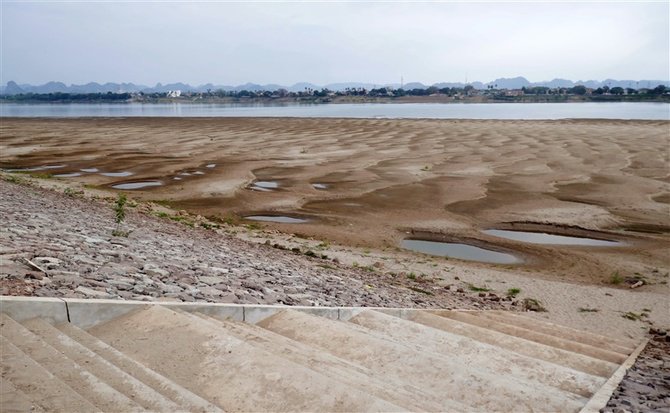 tps://globe.asahi.com/article/13885341
https://natgeo.nikkeibp.co.jp/atcl/news/20/021300095/
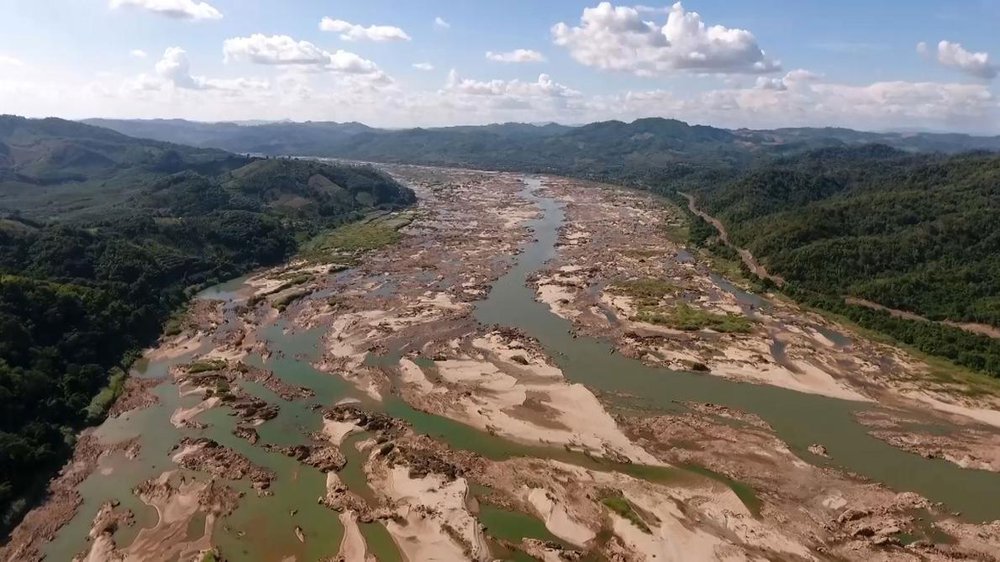 he reason why rice is susceptible to this effect is that rice uses the paddy field method and cannot grow without a water level for cultivation.
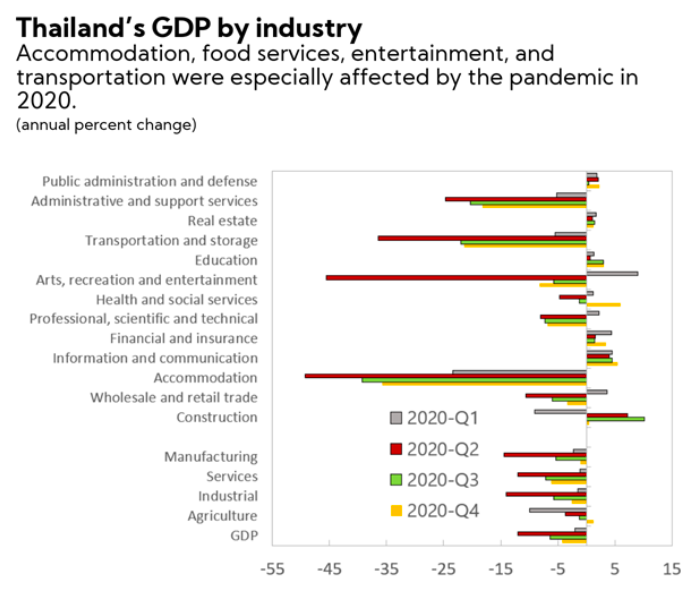
IMF said the Thailand Economic impact to Afrigultre was negative untill 2020-Q3
Solution:
In the future, I will always explain the photographic data from the earth satellites.
I wrote the Python code.
Upcoming actions:
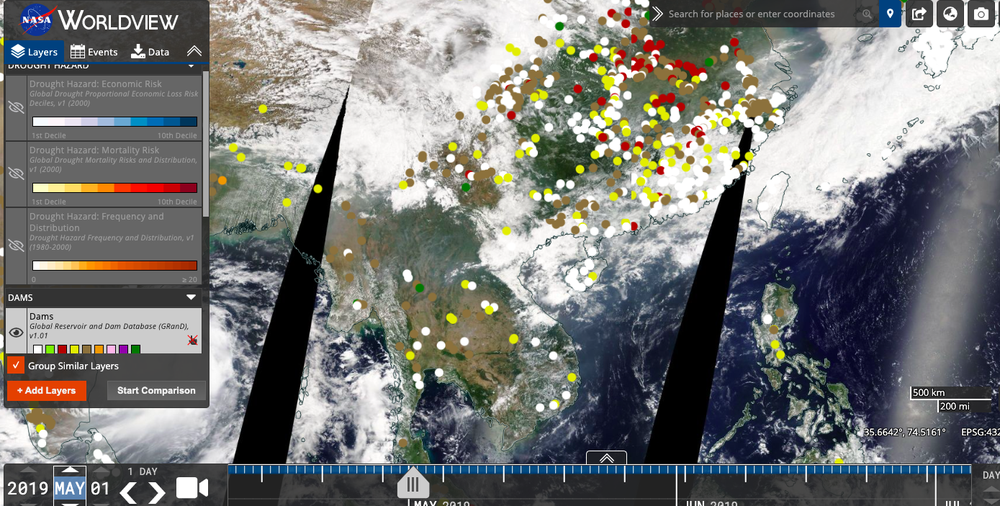
On a national scale, it is necessary to deliberate the Mekogong river water use between countries, based on the Dam plot data set . It allows to observe the number of growth of the irrigation dams seen from satellite by NASA WOLD VIEW for each cultivation type.
 Understanding the number of large-scale dams and soil moisture content
Soil moisture content needs to be deliberated while investigating the latest SMAP data.
In futue, in a domestic country scale, more localized and detailed agriculture impact dataset withh bwill be enhanced using ALOS-3, which is scheduled to be launched in 2021.
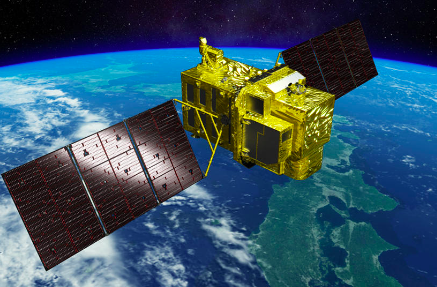
htps://www.eorc.jaxa.jp/ALOS/a/jp/alos-3/a3_about_j.htm
Data analysis using the open source QGIS or KML data available in the Google Earth app.