Awards & Nominations
Wings of the West has received the following awards and nominations. Way to go!
 Impact

The solution with the most potential to advance our knowledge of the effects of pandemics using the Earth Observing Dashboard.

Wings of the West has received the following awards and nominations. Way to go!
The solution with the most potential to advance our knowledge of the effects of pandemics using the Earth Observing Dashboard.
The longer human activities are changed due to the COVID-19 pandemic, the more visible, wider, and longer lasting the scope of environmental impacts may be. Your challenge is to tell a visual story about the impacts of the pandemic using Earth observation data and other complementary information.
For the first time in history, humans have gathered large-scale geospatial data about the effects of a pandemic state on the planet. We have seen that sudden, drastic changes in human behavior and socio-economic activities inevitably cause chain reactions in air and water quality. And we were wondering, how do the changes in our behavior affect the behavior of animals? Inspecting the populations of bird species in the US, we found that many changed when governmental restrictions were introduced. However, endangered bird species sightings are sparse by nature. We developed an awesome birdwatching app to raise awareness and gather data for further research in this field.
We created an app, ‘Wings of the West’, available at https://wingsofthewest.glideapp.io/, which is a repository of birds on the West Coast of the USA, featured on the Red List of the IUCN. The app provides exclusive details, such as what the bird is commonly known as, its scientific name, the family, and even how it sounds in the wild.
The app allows adventurous users to record their sightings of the birds in the app. This information can be used to accumulate population data for those species. The sighting feature also attracts more people to the practice of birdwatching.
Our app currently lists endangered birds from the West Coast of the USA. It is easily extendable to other species and animals, letting us increase awareness about all wildlife.
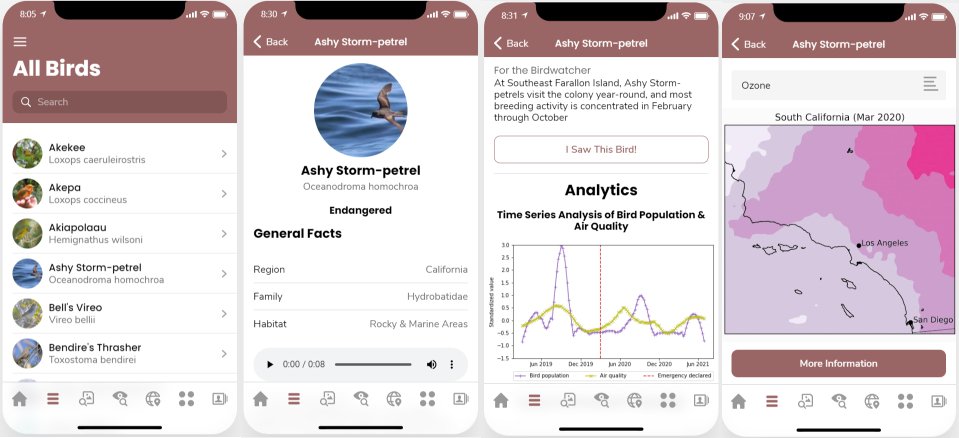
We also developed a methodology that lets us visualize bird population and relate it to air quality parameters in an easy-to-understand manner. It lets us generate air pollutant time series plots which are compared against bird population data, as well as animations and spatial visualizations of how the pollutants affect population density. This can be done for any part of the planet as a direct consequence of Sentinel-5’s planet-wide measurement availability. Furthermore, our method only relies on location data, so it can easily work for any other species.
While starting out with this opportunity, we had this grand idea of making a change, but only a vague one about how to go about it. All of us strongly believed that the first step towards rectifying our impact on Earth was to be aware of the disturbance we caused to the natural environment. Since wildlife forms the most integral part of the billion-pieced puzzle that is the environment, we agreed that our project should be something that would benefit it.
But while we were in the process of conducting research, we realized that there were so many people who weren’t even aware of the wildlife in their region or the dangers they faced. Pollution was rampant all over the world, environmental laws were being passed that ignored the chain effect on animals and birds, and nothing was being done. We were stymied, because how could we narrate a story to someone if the listener didn’t know the language?
Of course, the pandemic had its part to play. The movement restrictions had an unprecedented influence on human behavior, causing loud, echoing disruptions, not only to human life, but also to wildlife, as our research along this project would later reveal.
That was how our idea took root.
Our approach to implementation was very organized. Since all of us were from varied academic backgrounds, we divided work amongst ourselves according to our expertise.
There was a team member who was an astrophysicist, and he helped to procure satellite data from Euro Cube for the members who had a background in data science and analysis, who then worked on interpretation and visualization of data. Then there was the member who had substantial knowledge about the wildlife who took care of the collection of bird count data and the app development process. Finally, the fifth member who provided overall IT and technical resources and support worked on creating the (extremely colorful) video presentation that we have submitted.
We performed the data analysis using free and open-source tools. In particular, we used Python and its commonly accompanying libraries, such as Matplotlib, NumPy, and Pandas. We created several Jupyter notebooks and scripts to conduct our research. The complete development of the mobile application was done using Glide Apps and Google Suite.
The two main challenges we faced were missing data in the satellite images of air pollutants and little data about observations of endangered bird species. We overcame the first challenge with image post-processing by interpolation through time and smoothing to avoid artifacts. Overcoming the second challenge is the main topic of the proposed mobile application, essentially mitigating the weakness of bird data repositories, such as eBird.
One of the main achievements we pride ourselves upon is the amount of coordinated hard work that went into the making of this project. With each of us hailing from different countries and time zones, it took a crazy roller coaster ride of Google Meets calls, delayed responses and criticism, and staying awake and online at ungodly hours to finish this project in time. But oh! What an exhilarating ride!
We used data from the Sentinel-5 mission, which is a part of the European Earth Observation Programme, Copernicus.
We visualized satellite images of air pollutants from March of 2019 to June of 2021 for five western US states: California, Arizona, Hawaii, Oregon, and Washington. These dates approximately captured data from the year before and after the outburst of the pandemic, which allowed us to see the changes in air quality.
After interpolating missing values and smoothing the satellite images, we generated time series data for each state and pollutant by taking the average concentration of the pollutant concentration across the entire satellite image and repeating this for all available dates. We developed an ad-hoc air quality index where we manually weighted the available air pollutants.
The benefit of representing pollutant concentration as a time series is that we can easily compare it to other factors like the bird population in that state. We investigated bird populations for several species and plotted them against air pollutant concentrations. We found common patterns in some bird species populations and primarily the concentration of HCHO, SO2, NO2.
As an example, we found that during the winter months, the concentration of O3 decreased in Arizona after the pandemic started. At the same time, we saw an increase in the population of the Arizonian Snow Geese.
The plot shows more sightings of Snow Geese and an increase in average O3 values, as evident from the shift from darker blue colors in the bottom-left image to brighter green colors in the bottom-right image. The increase in Snow Geese population was also found in a scientific paper by LeTourneux et al. (2021), who linked the phenomenon to reduced human disturbances during the pandemic. Earth observation data, like the concentration of O3, can thus be used as a proxy for measuring human activity, as it is primarily generated by fossil fuel combustion. Using air pollutants as proxies for human activity has certain advantages over using vehicle count data, such as the density of cars. On the one hand, the measuring process is easier, because we avoid processing large satellite images with computationally expensive and potentially unstable algorithms. On the other hand, air pollutant data is readily available in the EuroDataCube portal for any place on the planet, whereas vehicle density data is only available for certain locations.
We also observed interesting patterns for other species, like the Californian Red-necked Phalarope, whose population fell as we saw an increase in HCHO concentration in parts of the state. We also saw that the number of observed Hawks in California rose significantly after the pandemic with a prominent peak during the winter of 2020/2021.
The video of our project demonstration is available here:
https://drive.google.com/file/d/12F37poycmCmZbmNvrCk7L1a43bufcaXH/view
Using an open-source toolkit enables straightforward integration of our methods into the EO Dashboard. The only requirement is to have access to a dataset of animal observations. The method is generalizable to every country due to the Earth coverage of the satellite images and to every animal type, although we have focused on birds for the scope of the Hackathon.
When a user is interested in the population of a species in a particular region, they may draw a rectangle or a polygon around it. At that time, a request is sent to obtain air pollutant data for that region, which may be presented as satellite images or time series data. Concurrently, we query the animal observation database and retrieve latitude and longitude for each sighting of that species within a specified time period. The system can generate bird population time series plots with air pollutants that can be toggled on/off. To facilitate comparisons, each time series is individually standardized. It can also generate visualizations like the water quality maps of the Adriatic sea, which are already available in the Dashboard. The visualizations show a dense air quality map with overlaid points that represent bird observations.
https://collections.eurodatacube.com/sentinel-5p-l2-tropomi/ - To obtain data from satellites regarding air quality over the chosen regions
https://www.acaps.org/covid-19-government-measures-dataset - Government regulations dataset
http://www.earthsendangered.com/search-regions3.asp - To obtain a comprehensive list of endangered birds, filtered according to region
https://www.iucnredlist.org/ - To obtain extensive information like scientific name, current population, type of habitat, etc. of the birds.
https://ebird.org/home - To obtain exclusive data regarding bird sightings in the chosen regions
http://offline.whatbird.com/ - To obtain audio clippings of different birds
http://datazone.birdlife.org/ - To obtain information about migration patterns, etc.
https://eol.org/ - To obtain high-quality images of the birds
“Stock footage provided by Videvo.net, Kiril Dobrev, NatureClip, downloaded from www.videvo.net"
“Guiton Sketch” Kevin MacLeod (https://incompetech.com/)
Licensed under Creative Commons: By Attribution 4.0 License
https://creativecommons.org/licenses/by/4.0/
#airquality #endangered #birds #density #sentinel5p #satellites #ebird #USA #westcoast
This project has been submitted for consideration during the Judging process.
