Storytelling in the COVID-19 Era

The longer human activities are changed due to the COVID-19 pandemic, the more visible, wider, and longer lasting the scope of environmental impacts may be. Your challenge is to tell a visual story about the impacts of the pandemic using Earth observation data and other complementary information.

Through the Looking Glass

Summary

Unlike Alice, we cannot walk through magic-looking glass into a world where COVID-19 is non-existent. However, when we look at ourselves, we see something important. We see our identities and our stories. Every person worldwide has a different and unique story to share, and that’s what we aim to do through our project. Creatively share experiences using Earth Observation Dashboard Mobility Data in a way anyone can understand. Since showing someone, data is one thing, but sharing experiences is another.

How I Addressed This Challenge


Pictures speak volumes, but experiences talk even louder. This was the driving force behind our project, our desire for anyone in the world to learn about COVID-19 in different countries and the experiences of the people living through it. The Earth Observation Dashboard is an excellent tool with so much storytelling power, and our goal was to develop something that would creatively use the COVID-19 data in the dashboard to its full potential, and we have done just that through what we have created for this challenge. 


What we have Created


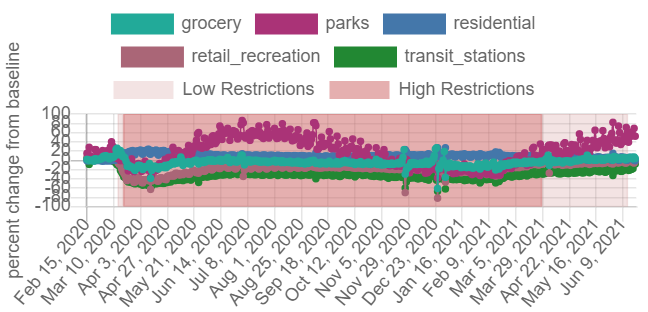
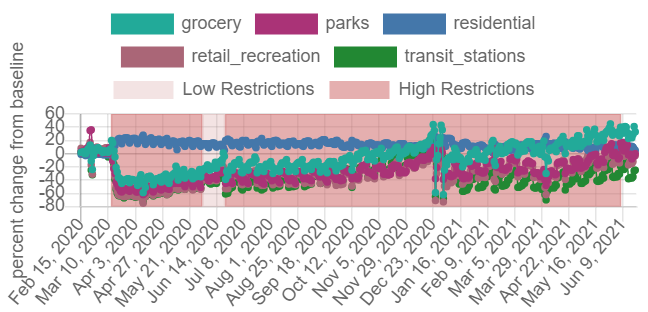
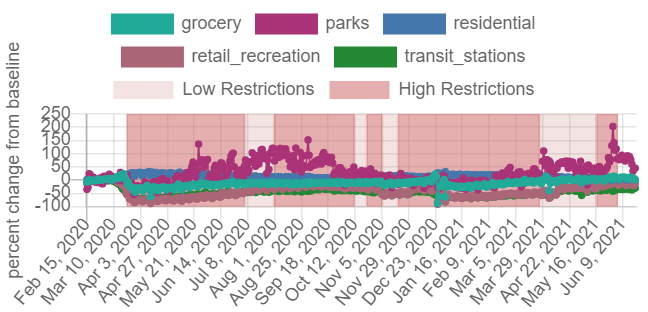
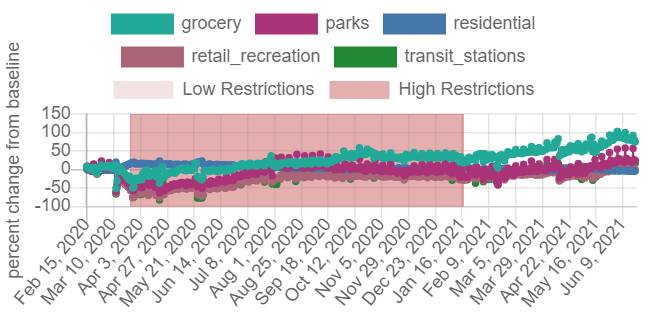
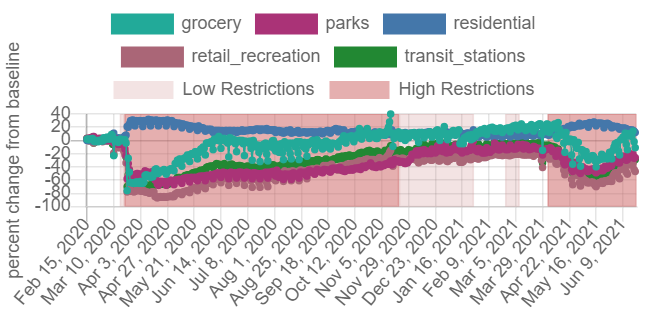
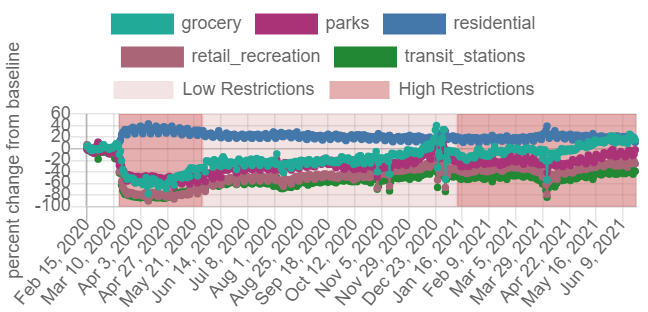
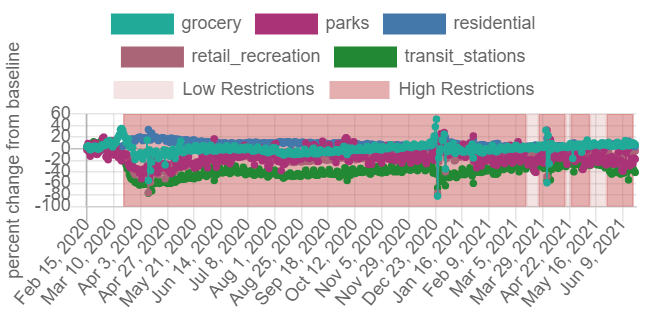
We have created a website interface called “Looking Glass,” which uses Mobility Data from the EO Dashboard and personal experiences to explain how COVID-19 has affected the mobility of different countries in a captivating way. Our website also includes a guided tour created on Google Earth to give users visual images of how each country has been affected. 


The logo of our website


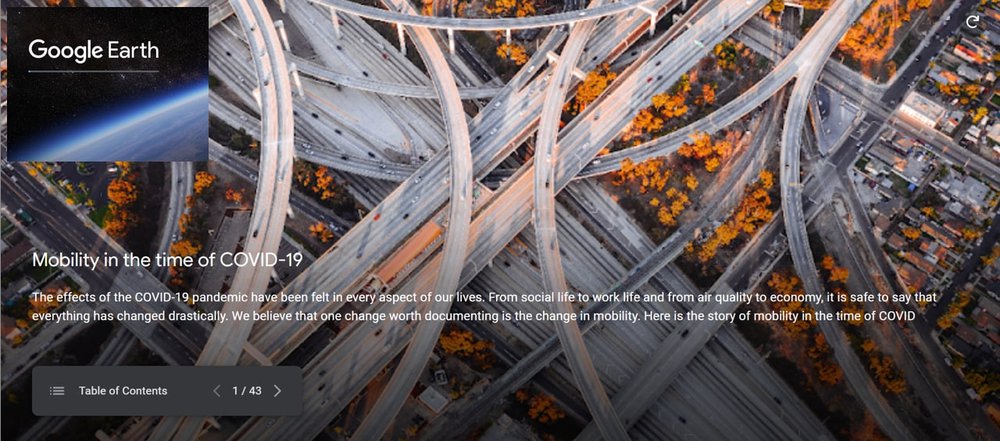
The starting page of our Google Earth guided tour.


Why it is important


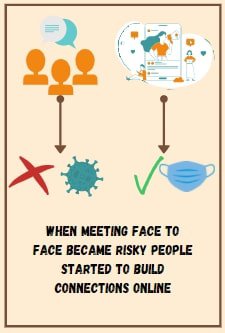
Each member of the "Through the Looking Glass" team comes from different continents, specifically in Asia, Africa, North America, Europe, and Australia, with ties to South America. As humans are known to be social creatures, this pandemic has brought an end to face-to-face communication for now. The creation of our team, "Through the Looking Glass" unexpectedly, created a long-lasting bond as we shared our stories despite having different cultures, ethnicity, nationality, and race.


Our project is integral in these times of uncertainty since it provides a safe haven for everyone, showing that even if we are separated by borders and oceans, our experiences can help us connect. No matter where we are on the planet, we all look through the same mirror, the same looking glass.


"Human Connection is More Important than Ever during the Coronavirus" says Forbes.com


What does it do?


The project was explicitly created to allow for users to interact, learn, share, and understand their circumstances during COVID-19 in each country and to provide solutions for handling the challenges that the COVID-19 pandemic brought.


What we hope to achieve

Through our project, we hope that more people who feel lost or confused during these times can connect through what we have created and realize they are not alone in this. Furthermore, we hope that through our project, EO Dashboard data can be shown in a creative way that explains why specific changes in data have occurred.

How I Developed This Project

Inspiration


The project comes from the concept of a "Mirror." It's about you and us standing in front of a mirror that allows us to reflect and reminisce about our present life going through this pandemic. The team's motto, "Billions of Stories in One Glance," inspires everyone across the globe to share our individual circumstances and use them to become interconnected with others around the planet. Through these difficult times, the team wants everyone to know that they're not alone; as a matter of fact, it's about uniting nations of people, as well as understanding and getting to know each other better through the interface of a website and the Google Voyager platform that we have created.


Our Approach


When developing the project, our main goals were to create something that utilized the EO Dashboard's Mobility data to its highest potential while also creatively communicating the stories on the dashboard mixed with personal experiences from different countries. We decided to make a website since it would act as the brain of our project. Moreover, it would be easy to integrate into the EO Dashboard. On our website, when you click on a country, you would be taken to the different Google Voyager tours that exemplify EO Dashboard Mobility data with visuals from Google Earth/pictures we've collected and personal experiences.


Tools and Coding Languages


The website was coded in HTML and CSS, utilizing the website trinket.io for the primary coding and editing of the code (because of the option to view the website while you code it). Then, the code was transferred to GitHub for more straightforward implementation into the EO Dashboard. The website was then given a domain through netlify, with the main code still being on the GitHub page. [The links to the last two resources (GitHub and netlify) can be provided upon request, as all of the code transferred to the GitHub and netlify websites is also available in the trinket.io website in greater detail].


Problems and Achievements


One of our main challenges was the difference in time zones. Each team member came from a different time zone, so it was challenging to find the time to be online. However, we solved this issue by finding times where we were all available to meet on Zoom and discuss and continue our project together. Moreover, we realized what we thought was a challenge (the difference in time zones) is actually an asset of our team since we realized that even if some members were asleep, there will always be a few other members awake and working on our project, making us a team who works 24/7. One of our main achievements was when we finished all our Google Voyager tours since we could finally publish them on our website, and we knew how practical our hard work would be for people trying to understand COVID-19 experiences in different countries.

How I Used Space Agency Data in This Project

In this project, we relied heavily on data from the EO dashboard. Notably, we used data from mobility graphs on the dashboard in our stories to represent the data in a more accessible way to the general public. Mobility data was vital in our project since the EO dashboard for mobility correlates with our personal experiences. For example, there was an increase in the Grocery category in Australia before the first high restriction lockdown, as shown in the EO data. This corresponds well with Rusandi’s experience of high levels of panic buying before Australia started high restriction lockdowns. 


The number of infected people each month, the date of vaccination rollout, the number of vaccinated people, and the daily rate of vaccination were collected and used in our project and the COVID-19 indicator on the Dashboard.


Mobility Data used for USA


Mobility Data used for Venezuela


Mobility Data used for United Kingdom


Mobility Data used for Egypt


Mobility Data used for India


Mobility Data used for Philippines


Mobility Data used for Australia

Project Demo

Demo Video:https://www.youtube.com/watch?v=2NiBiP4qYJ0


Thumbnail of our YouTube demo video.

Earth Observing Dashboard Integration

We believe the best way to integrate our project into the EO Dashboard is to make it a link within the Mobility Data Indicator. This way when a user clicks on the mobility data part of the dashboard, the links for our website and Google Earth guided tours will be available. This will be very useful since it would show how the data shown on the dashboard correlates with what happened in certain countries. Moreover, it would make the data on the dashboard more captivating and simpler so anyone of any age can understand it. If the project needed to be integrated into the EO Dashboard by code, the code from github could be integrated as another page on the EO Dashboard, or as part of the dashboard itself under the mobility indicator.


Source Code:https://trinket.io/html/8889461daa

Demo Website:https://www.trinket-shell.com/392a3bcf6b59f0f2/index.html


Google Earth Guided Tours:


North America: https://earth.google.com/earth/d/1Tf3BWe2T5qRY483Tm79bP1p7rsoRjitY?usp=sharing

South America: https://earth.google.com/earth/d/17Rr769utTKcMomoec2MwNJn_9vqPEJ7G?usp=sharing

Europe:https://earth.google.com/earth/d/1B9VBlombK4zj81Rspf9nc5w03zeLsVJM?usp=sharing

Africa: https://earth.google.com/earth/d/1MHtugsbiTtXrWtDfNOIGwrNn_5jEFsjH?usp=sharing

Asia (India): https://earth.google.com/earth/d/1_BWyMw3CbRyDOQIkGkyJDfEbxHUr9kpZ?usp=sharing

Asia (Philippines): https://earth.google.com/earth/d/1Dauqc9N9Jwegvv_WEGssg7A4JrgMrvMv?usp=sharing

Oceania: https://earth.google.com/earth/d/16vOTbLpbh2OA00op3le28SqDoVPKCGca?usp=sharing

Data & Resources

Data


Mobility Data - Earth Observation Dashboard https://eodashboard.org/?poi=GG-GG Accessed: 2021/26/06

COVID-19 Data - Earth Observation Dashboard Accessed: 2021/26/06

Google Earth - https://www.google.com.au/earth/ Accessed: 2021/26/06


Articles


Asia:


 News Article (Manila Times)


Siy, R. (2020, March 14). Mobility in the Time of COVID-19. https://www.manilatimes.net/2020/03/14/business/business-top/mobility-in-the-time-of-covid-19/702925 Accessed: 2021/24/06

Palafox, F. Jr. (2020, September 10). Transport, Access and Mobility. https://www.manilatimes.net/2020/09/10/opinion/columnists/transport-access-and-mobility/766699 Accessed: 2021/24/06

Siy, R. (2021, April 24). Pandemic as Catalyst for Better Mobility. https://www.manilatimes.net/2021/04/24/business/columnists-business/pandemic-as-catalyst-for-better-mobility/867100 Accessed: 2021/24/06

Siy, R. (2021, May 01). Pandemic as Catalyst for Better Mobility (Part 2). https://www.manilatimes.net/2021/05/01/business/business-top/pandemic-as-the-catalyst-for-better-mobility-part-2/869038 Accessed: 2021/25/06

Siy, R. (2021, May 08). Our Public Transportation Emergency. https://www.manilatimes.net/2021/05/08/business/columnists-business/our-public-transportation-emergency/871334 Accessed: 2021/25/06

Lava, J. III. (2021, May 31). Tech for Good. https://www.manilatimes.net/2021/05/31/business/tech-for-good/1801319 Accessed: 2021/25/06


News Article (Hindustan Times)


HT Correspondent. (2020, March 22). With Clapping, Bell Ringing, India Unites to Thank Coronavirus Fighters. https://www.hindustantimes.com/india-news/with-clapping-bell-ringing-india-unites-to-thank-coronavirus-fighters/story-c7WKBbWyJvLPfUjRUa4N2J.html Accessed: 2021/24/06


Africa:


 Egypt Independent. (2020). https://www.almasryalyoum.com/news/details/1628801

https://www.youm7.com/story/2020/4/8/%D8%A7%D9%84%D8%AC%D8%B1%D9%8A%D8%AF%D8%A9-%D8%A7%D9%84%D8%B1%D8%B3%D9%85%D9%8A%D8%A9-%D8%AA%D9%86%D8%B4%D8%B1-%D9%82%D8%B1%D8%A7%D8%B1-%D8%B1%D8%A6%D9%8A%D8%B3-%D8%A7%D9%84%D9%88%D8%B2%D8%B1%D8%A7%D8%A1-%D8%A8%D9%85%D8%AF-%D8%B3%D8%B1%D9%8A%D8%A7%D9%86-%D8%AD%D8%B8%D8%B1-%D8%A7%D9%84%D8%AA%D8%AC%D9%88%D9%84/4714843 Accessed: 2021/24/06

Youm7 (2020, March 21). https://www.youm7.com/story/2020/3/21/%D8%A7%D9%84%D8%A3%D9%88%D9%82%D8%A7%D9%81-%D8%AA%D9%82%D8%B1%D8%B1-%D8%BA%D9%84%D9%82-%D8%AC%D9%85%D9%8A%D8%B9-%D8%A7%D9%84%D9%85%D8%B3%D8%A7%D8%AC%D8%AF-%D9%84%D9%85%D8%AF%D8%A9-%D8%A3%D8%B3%D8%A8%D9%88%D8%B9%D9%8A%D9%86-%D9%88%D8%AA%D8%BA%D9%8A%D8%B1-%D8%B5%D9%8A%D8%BA%D8%A9-%D8%A7%D9%84%D8%A3%D8%B0%D8%A7%D9%86/4681326

(2020, March 24). https://www.youm7.com/story/2020/3/24/%D9%86%D9%86%D8%B4%D8%B1-%D9%82%D8%B1%D8%A7%D8%B1%D8%A7%D8%AA-%D8%B1%D8%A6%D9%8A%D8%B3-%D9%85%D8%AC%D9%84%D8%B3-%D8%A7%D9%84%D9%88%D8%B2%D8%B1%D8%A7%D8%A1-%D9%84%D9%85%D9%83%D8%A7%D9%81%D8%AD%D8%A9-%D9%81%D9%8A%D8%B1%D9%88%D8%B3-%D9%83%D9%88%D8%B1%D9%88%D9%86%D8%A7-%D8%A3%D8%A8%D8%B1%D8%B2%D9%87%D8%A7-%D8%AD%D8%B8%D8%B1/4686885 Accessed: 2021/24/06

Youm7 (2020, April 08). https://www.youm7.com/story/2020/5/20/%D8%A7%D9%84%D8%AC%D8%B1%D9%8A%D8%AF%D8%A9-%D8%A7%D9%84%D8%B1%D8%B3%D9%85%D9%8A%D8%A9-%D8%AA%D9%86%D8%B4%D8%B1-%D9%82%D8%B1%D8%A7%D8%B1%D8%A7%D8%AA-%D8%B1%D8%A6%D9%8A%D8%B3-%D8%A7%D9%84%D9%88%D8%B2%D8%B1%D8%A7%D8%A1-%D8%A8%D8%B4%D8%A3%D9%86-%D8%A7%D9%84%D8%A5%D8%AC%D8%B1%D8%A7%D8%A1%D8%A7%D8%AA-%D8%A7%D9%84%D8%A7%D8%AD%D8%AA%D8%B1%D8%A7%D8%B2%D9%8A%D8%A9-%D9%84%D8%B9%D9%8A%D8%AF/4783740 Accessed: 2021/25/06

Sky News Arabia. (2020). https://www.skynewsarabia.com/middle-east/1332241-%D9%85%D8%B5%D8%B1-%D8%AA%D9%85%D8%AF%D9%8A%D8%AF-%D8%BA%D9%84%D9%82-%D8%A7%D9%84%D9%85%D8%B3%D8%A7%D8%AC%D8%AF-%D9%88%D8%AA%D8%B9%D9%84%D9%8A%D9%82-%D8%B5%D9%84%D9%88%D8%A7%D8%AA-%D8%A7%D9%84%D8%AC%D9%85%D8%B9-%D9%88%D8%A7%D9%84%D8%AC%D9%85%D8%A7%D8%B9%D8%A7%D8%AA Accessed: 2021/25/06


North America:


Centers for Disease Control and Prevention. (2020, June 05). Evidence for Limited Early Spread of COVID-19 within the United States, January - February 2020. https://www.cdc.gov/mmwr/volumes/69/wr/mm6922e1.htm Accessed: 2021/24/06

Udalova, V. (2021, March 08). Pandemic Impact on Mortality and Economy Varies Across Age Groups and Geographies. https://www.census.gov/library/stories/2021/03/initial-impact-covid-19-on-united-states-economy-more-widespread-than-on-mortality.html Accessed: 2021/25/06


South America:


Human Rights Watch. (2020, August 07). Venezuela Events of 2020. https://www.hrw.org/world-report/2021/country-chapters/venezuela# Accessed: 2021/24/06


Europe:


"UK News - BBC News". BBC News, n.d., https://www.bbc.com/news/uk.  Accessed: 2021/24/06

"UK News - the Latest Headlines from the UK | Sky News". Sky News, n.d., https://news.sky.com/uk. Accessed: 2021/25/06


Australia :


 Lowy Institute. State of Mind: How Australians See the Pandemic and Efforts to Help. https://www.lowyinstitute.org/the-interpreter/state-mind-how-australians-see-pandemic-and-want-help Accessed: 2021/24/06

Victoria State Government - Health and Human Services. Victorian Coronavirus (COVID-19) Data. https://www.dhhs.vic.gov.au/victorian-coronavirus-covid-19-data Accessed: 2021/24/06


Tags

#social isolation #COVID-19 mobility data #storytelling #creative #captivating

Judging

This project has been submitted for consideration during the Judging process.