Impacts of covid 19
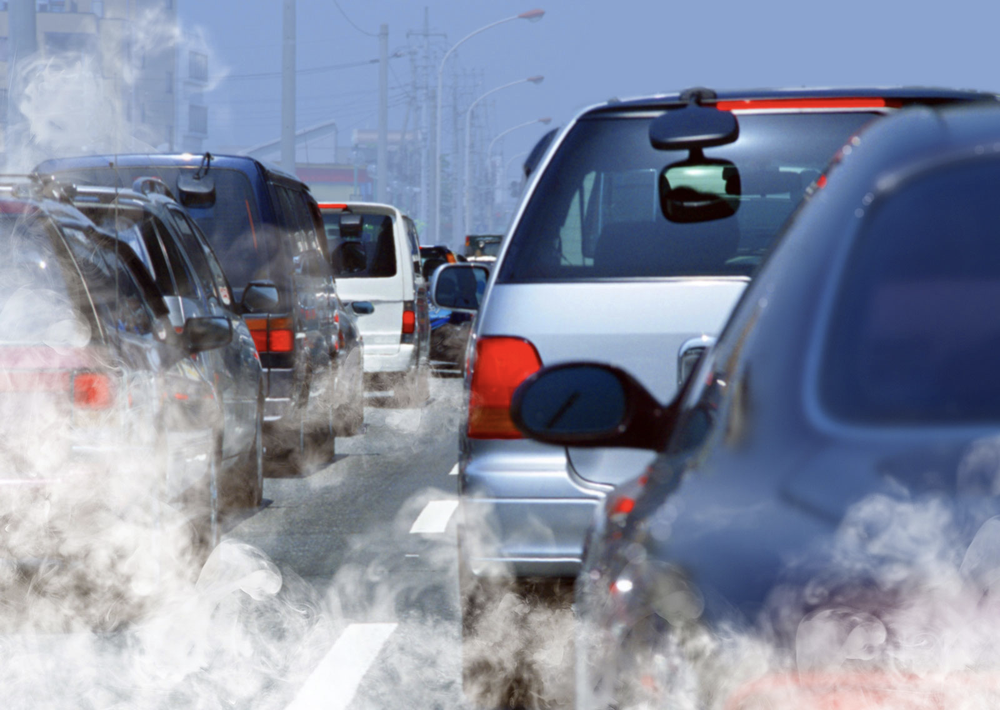
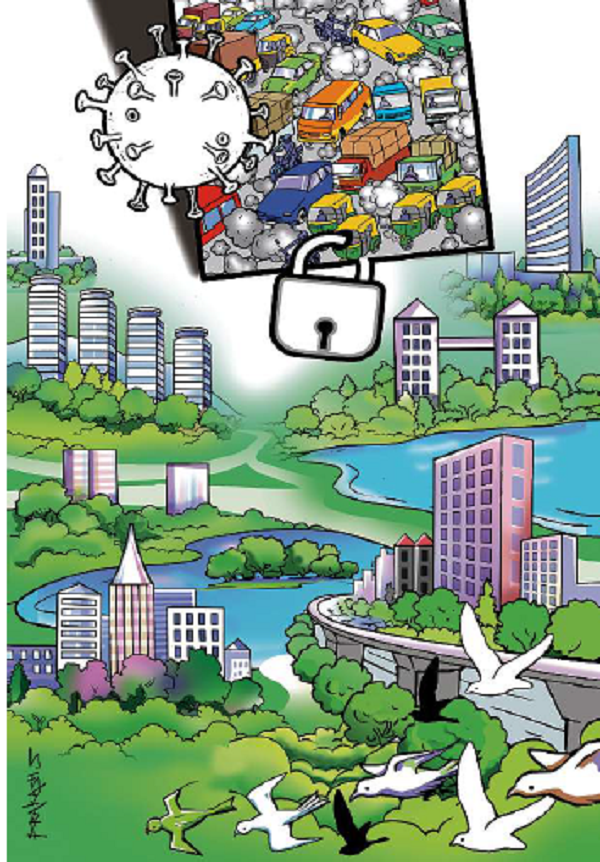
In an effort to reduce the spread of coronavirus disease 2019 (COVID-19), governments around the world imposed restrictions on both social life and economic activity. By the end of March 2020, 76% of the global population lived in countries with stay-at-home orders. The pandemic has changed the way we look at the world around us.We realised that we don’t actually have to do anything to stop global warming and its negative impacts on our environment .Our planet heals itself. Our interference just worsen everything. Because of strict quarantine around the world and therefore relatively less transportation has reduced air pollution to a great extent.

For instance:
Let us look at impact of human activity on NO2 levels.
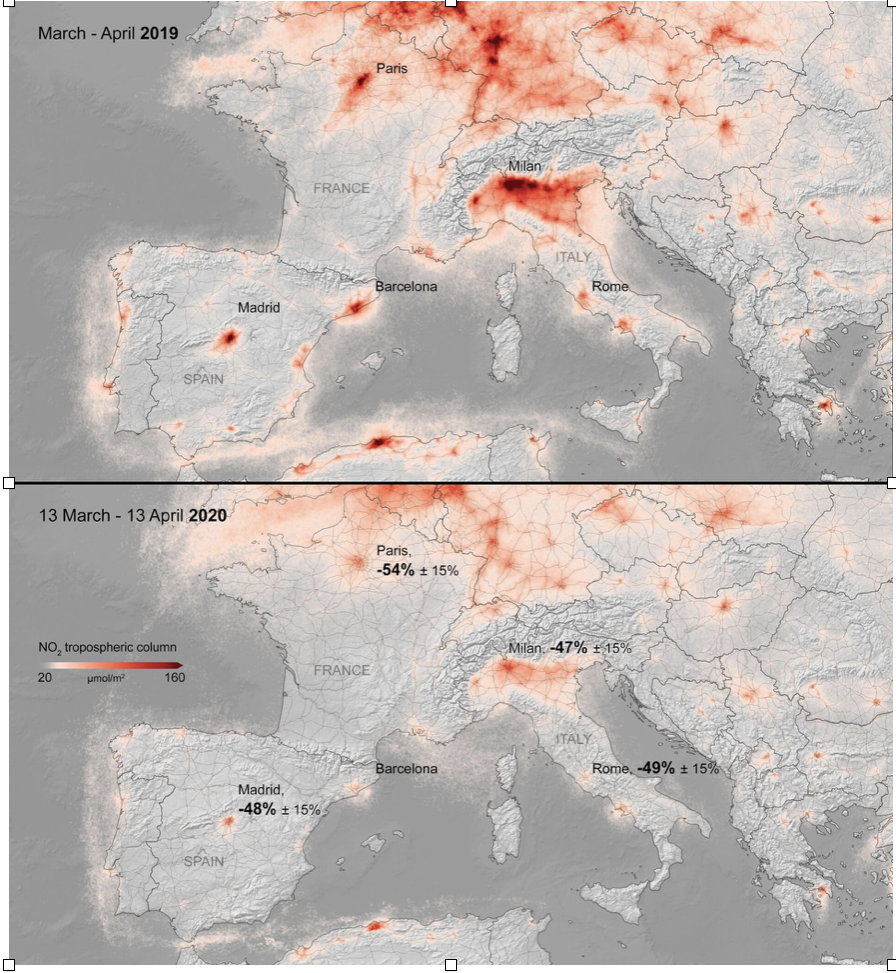
Data shown here from the Tropospheric Monitoring Instrument (TROPOMI jointly developed by The Netherlands and ESA) on the European Space Agency’s (ESA) Copernicus Sentinel-5P satellite satellite and the Netherlands-Finnish instrument Ozone Monitoring Instrument (OMI) on the Aura satellite, show significant drops in regional nitrogen dioxide (NO2) levels that coincide with reduced traffic and industrial activity.
The measurements presented here combine and average nitrogen dioxide data to account for variations in NO2 caused by weather, such as clouds and wind. This provides a clearer picture of the impact of human activity on NO2 levels. In Madrid, Milan, Rome, and Paris, for example, TROPOMI data show about a 50% reduction in NO2 from March 13-April 13, 2020 compared to the same months the year before. These reductions coincide with implementation of strict quarantine measures across Europe.
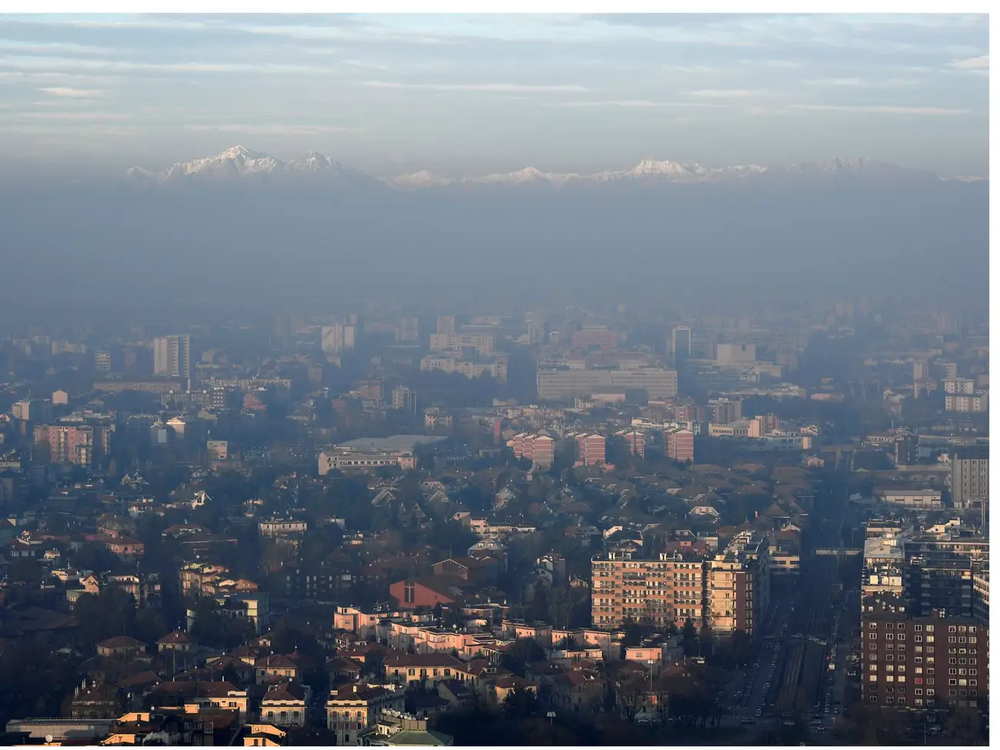
BEFORE: The BBC reported that Milan was named Europe's most polluted city in 2008, but that smog is still a problem today.
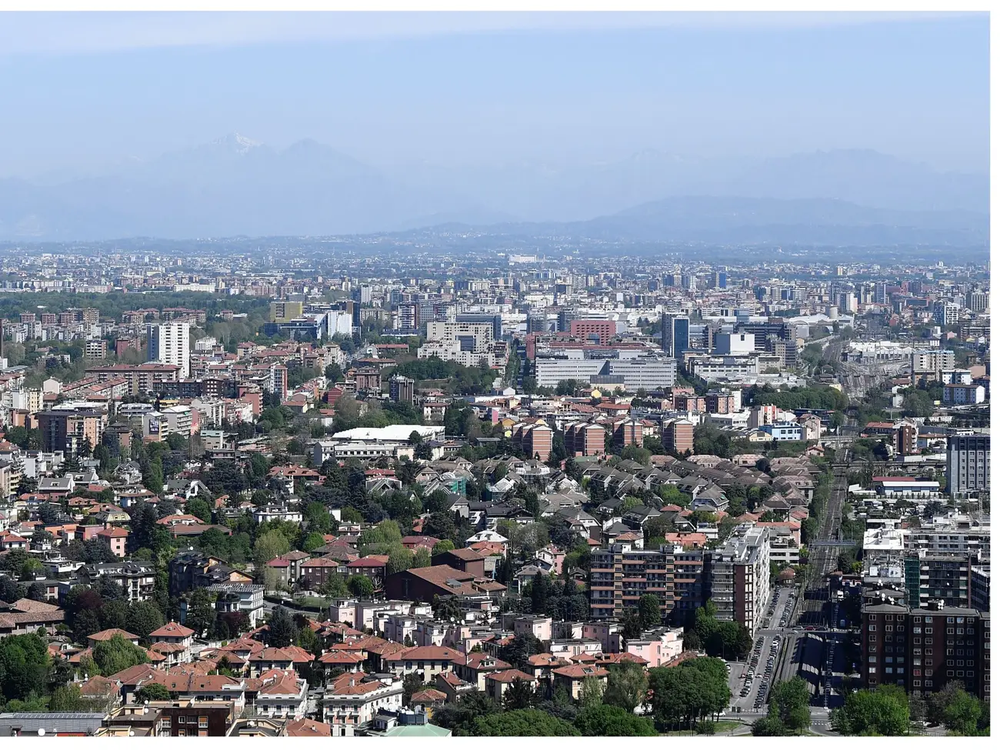
AFTER: Once traffic dropped during lockdown, so did air pollution. In response, Milan is thinking about introducing a plan to reduce car use after the pandemic to avoid a rebound, according to The Guardian.
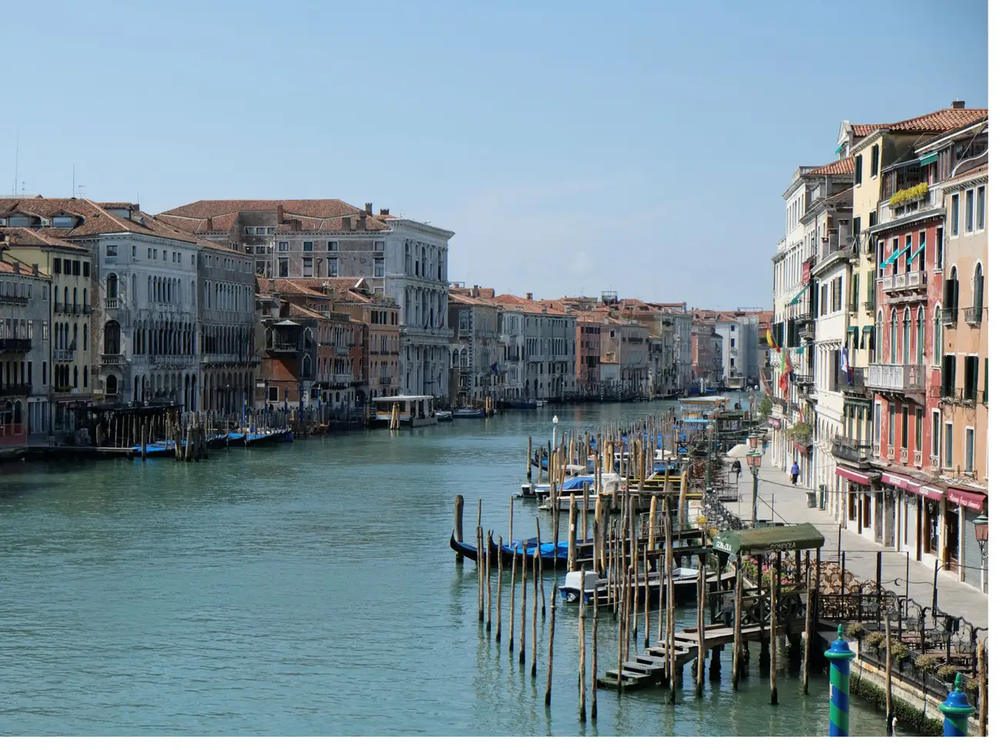
BEFORE: Venice, Italy's, high-traffic waterways were generally murky.
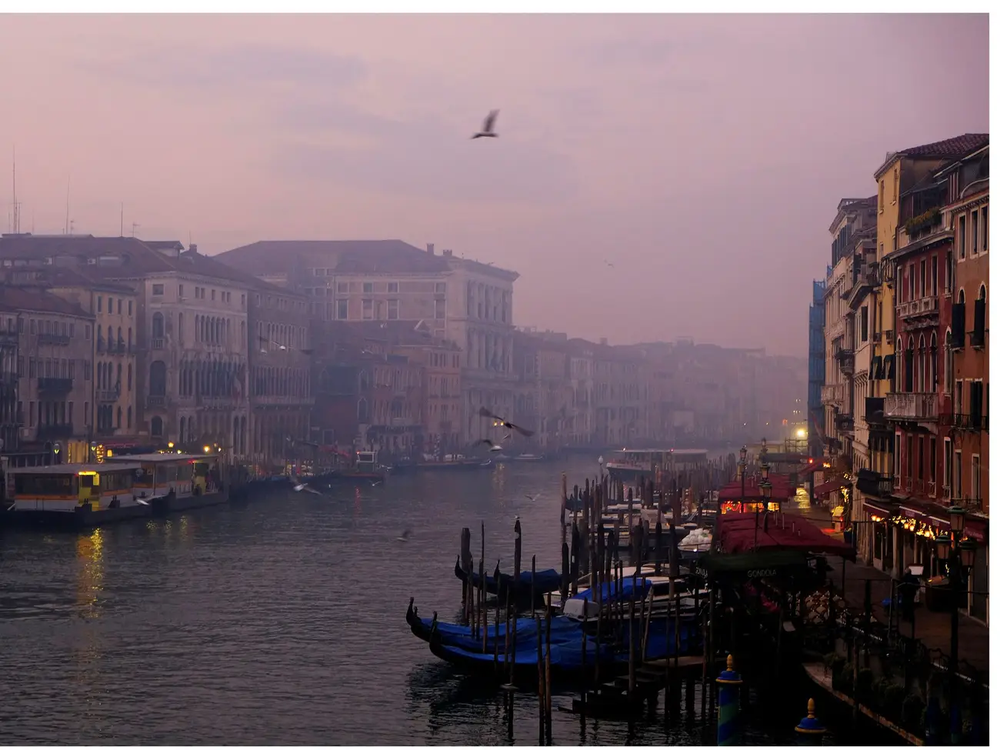
AFTER: In March, photos emerged of the canals looking so clear that you could see to their bottom. However, the city's mayor told CNN that this was due to "less traffic on the canals, allowing the sediment to stay at the bottom."
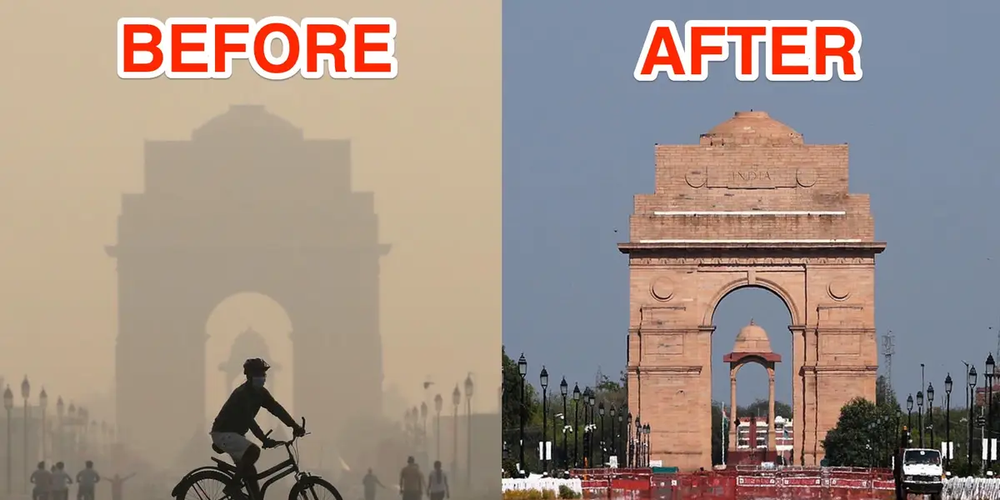
BEFORE: According to The New York Times, India was home to 14 of the 20 cities with the most hazardous air in 2019.
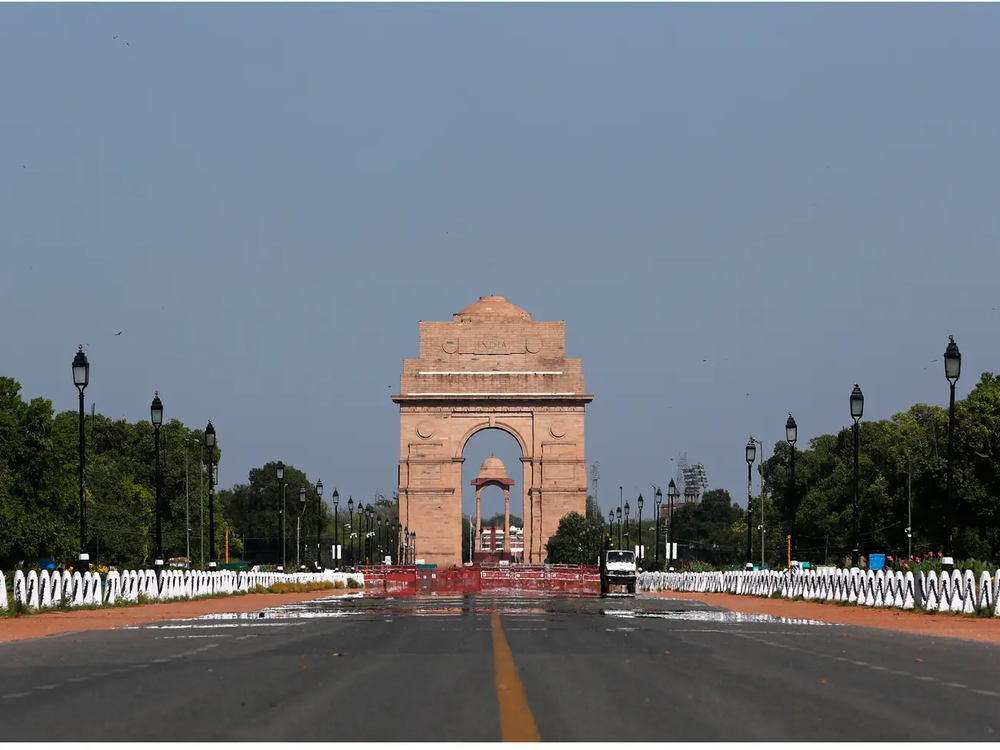
AFTER: Delhi hasn't seen air this clear for decades. "I look at the sky quite often and enjoy its blueness from my balcony," a retired English professor told The New York Times in April.
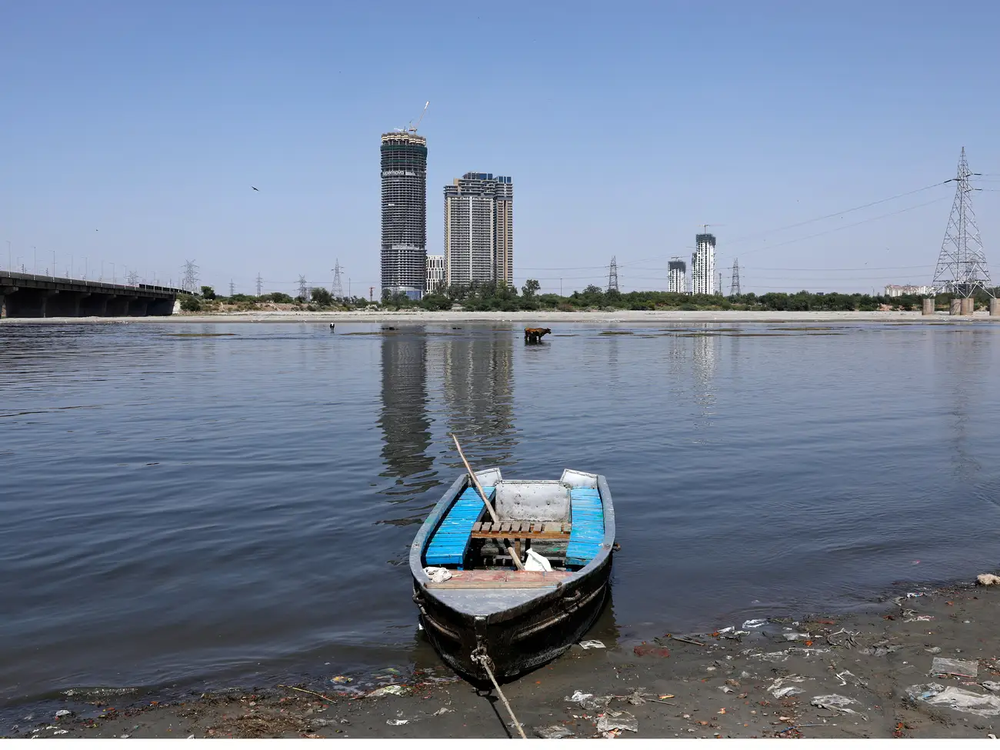
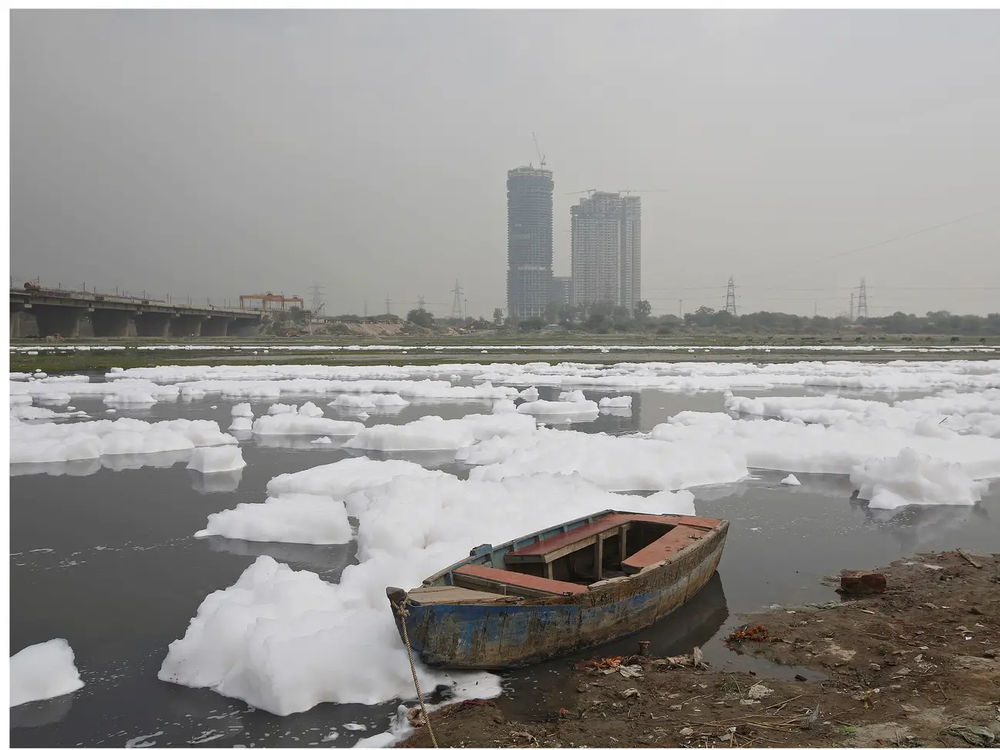
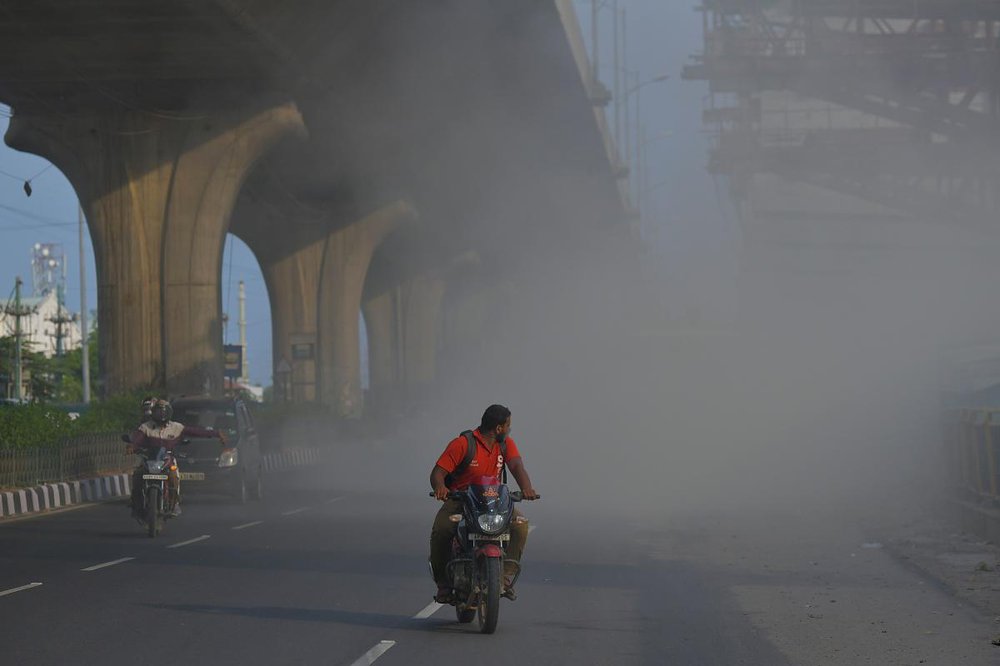
BEFORE: In 2019, CNN cited "dangerous levels of pollution" in New Delhi, describing India's capital as "shrouded" in "a toxic, throat-searing cloud of brown smog."
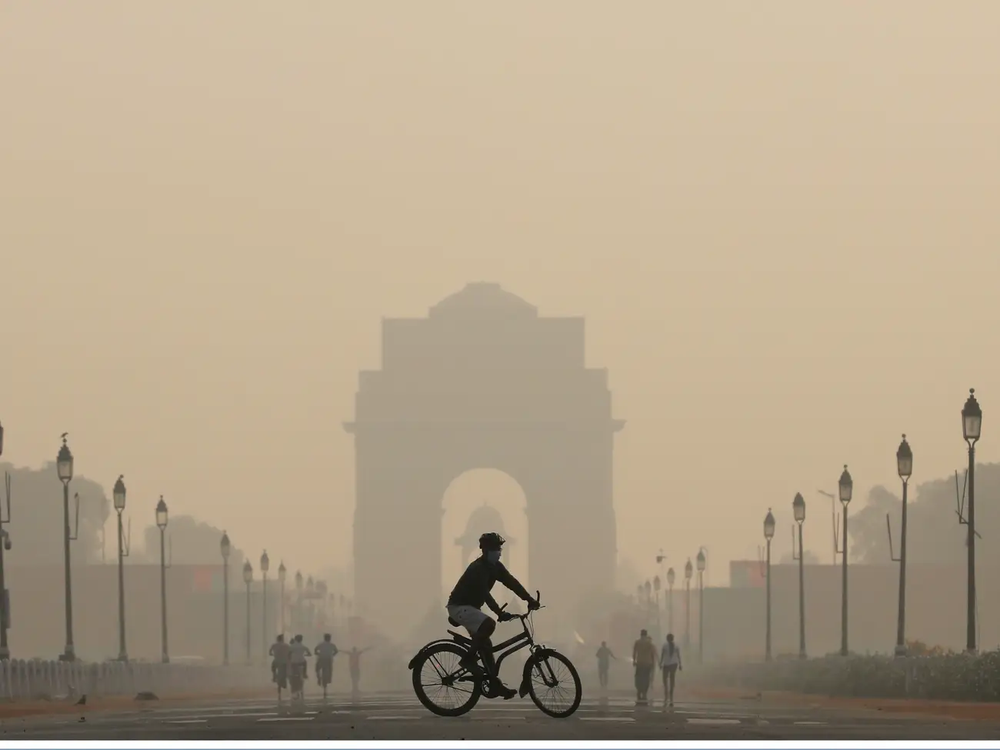
AFTER: According to Reuters, New Delhi experienced "the longest spell of clean air on record" back in April.
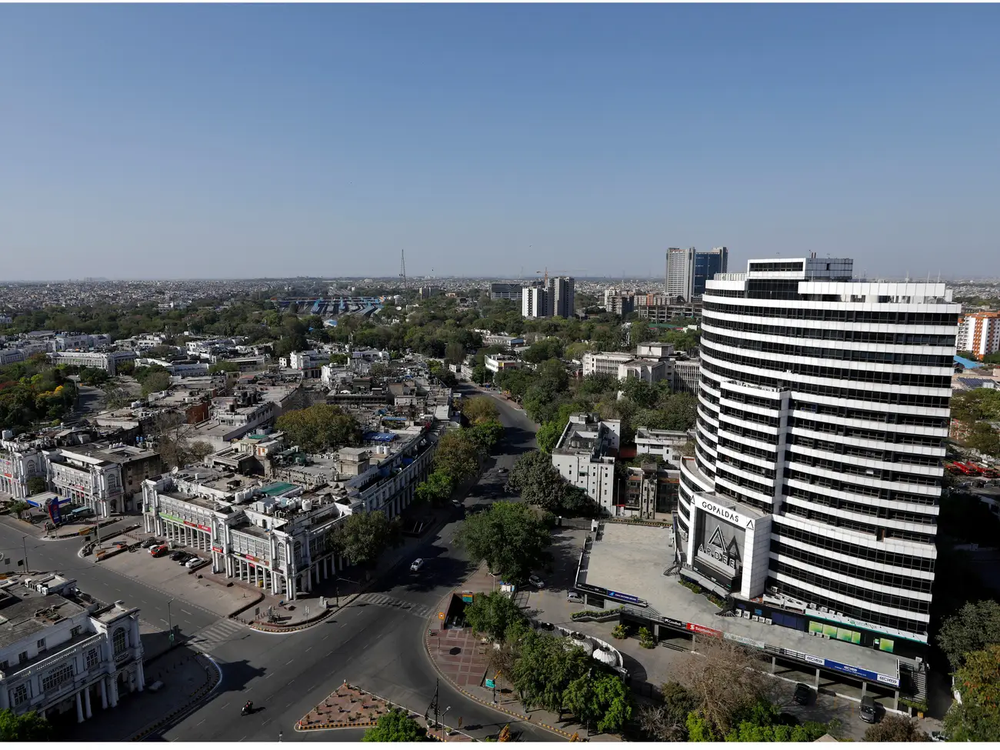
BEFORE: When India imposed its first lockdown in late March, it encompassed 1.3 billion people, making it the world's largest lockdown, according to CNN.

AFTER: According to the Washington Post, air pollution in New Delhi dropped by almost 60% within just a few days of the beginning of the lockdown.
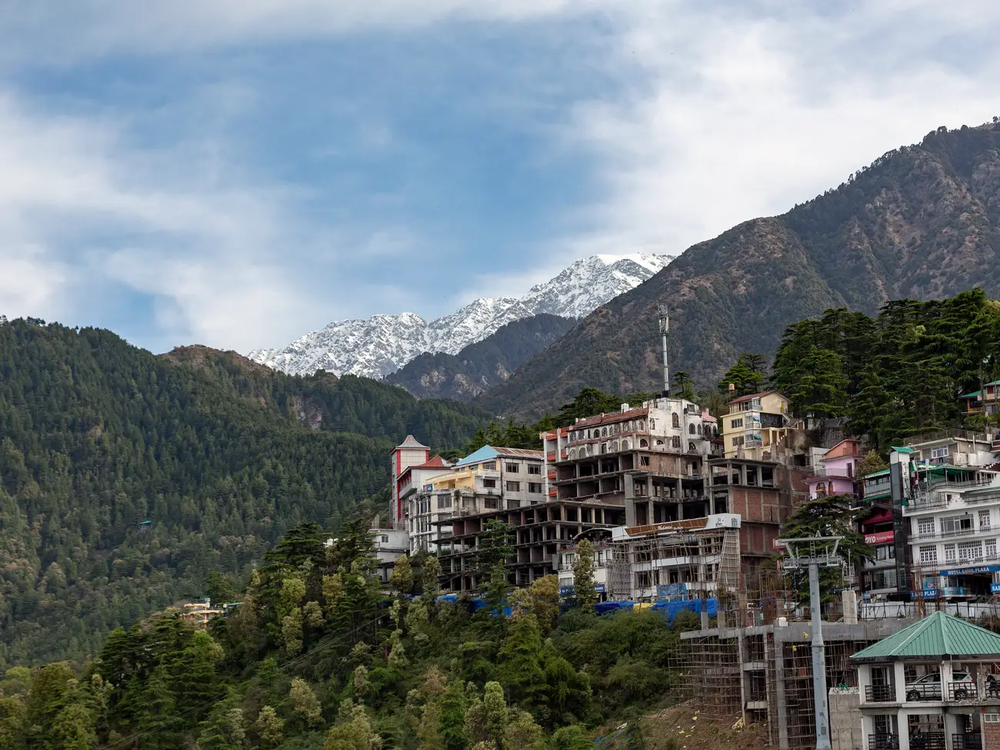
BEFORE: According to a previous Insider report, some parts of India saw the Himalayas for the first time in decades.
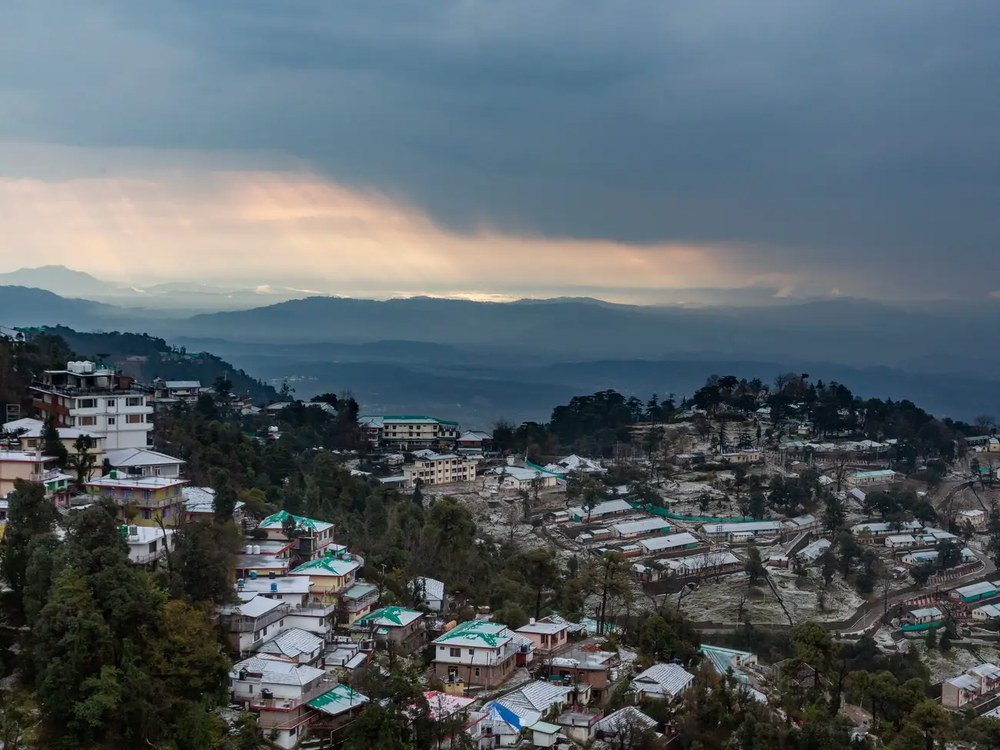
AFTER: The Dhauladhar range is clearly visible during lockdown in Dharmsala.
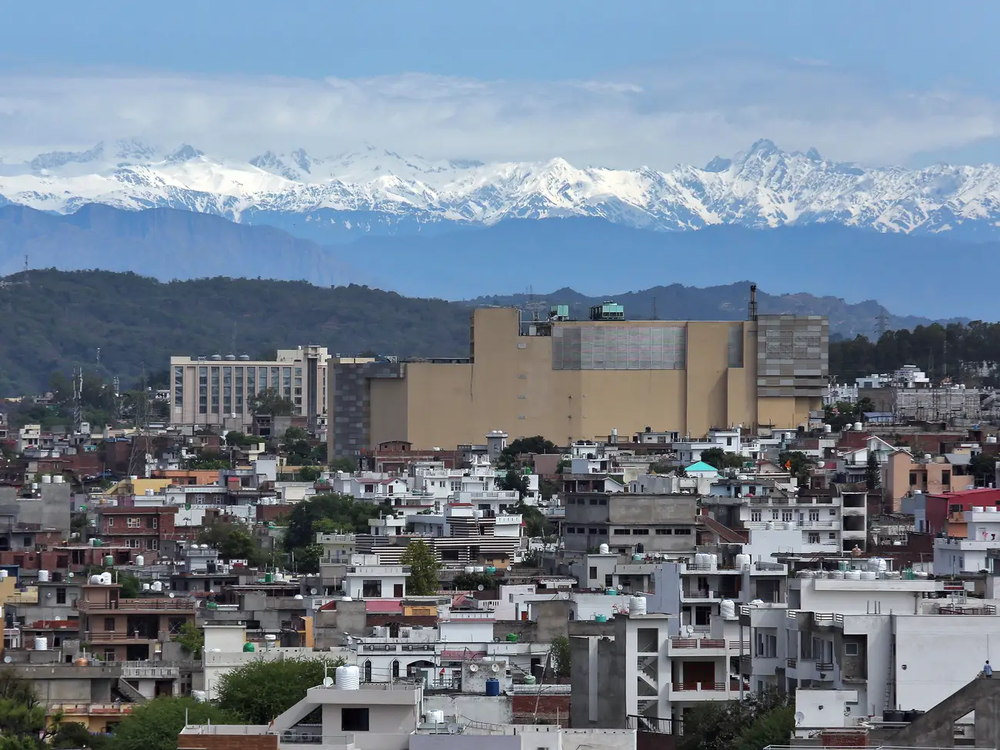
Similarly, the snow-covered Pir Panjal mountain range was visible from a residential area in Jammu, India, in early May.
BEFORE:Karnataka,India was considered to be one of the most polluted cities of India.
AFTER:Reduction in 70% of the pollution by shutting of industries,vehicular emission.
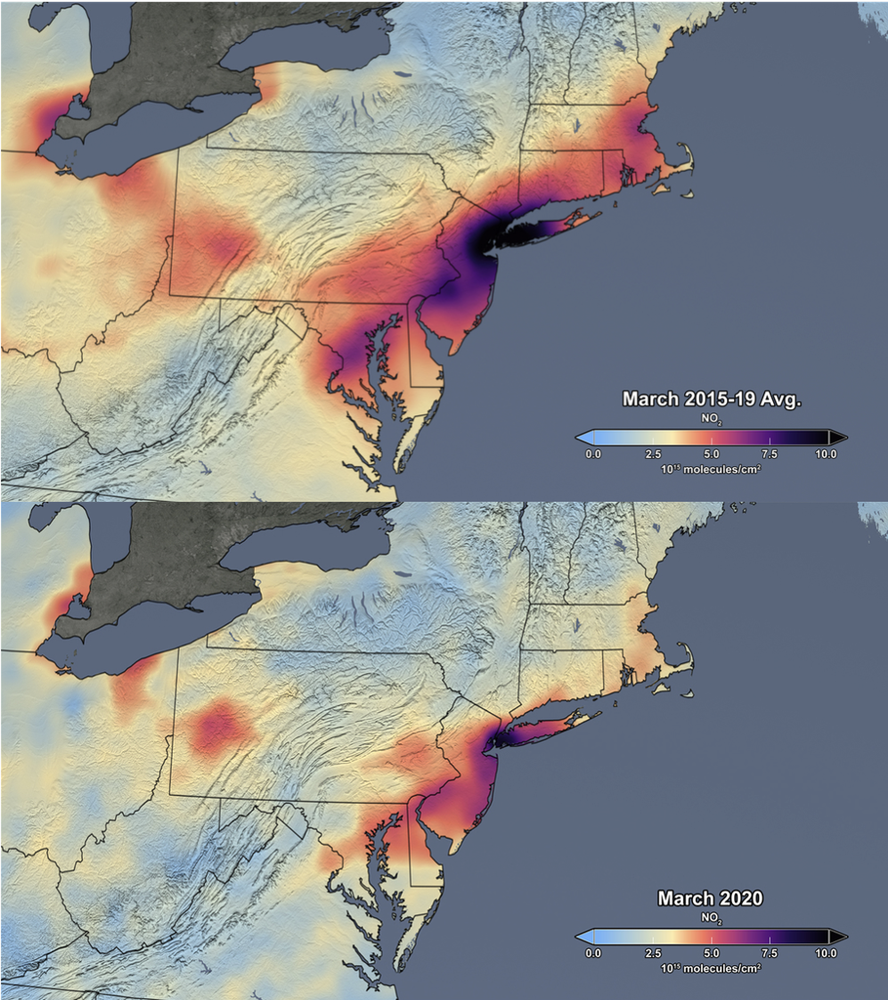
Similar reductions in air pollution have been observed in the Northeast United States. From Washington, D.C. to Boston, averaged OMI NO2 column data during lockdowns in March 2020 were 30% lower than averaged data for March 2015-2019.
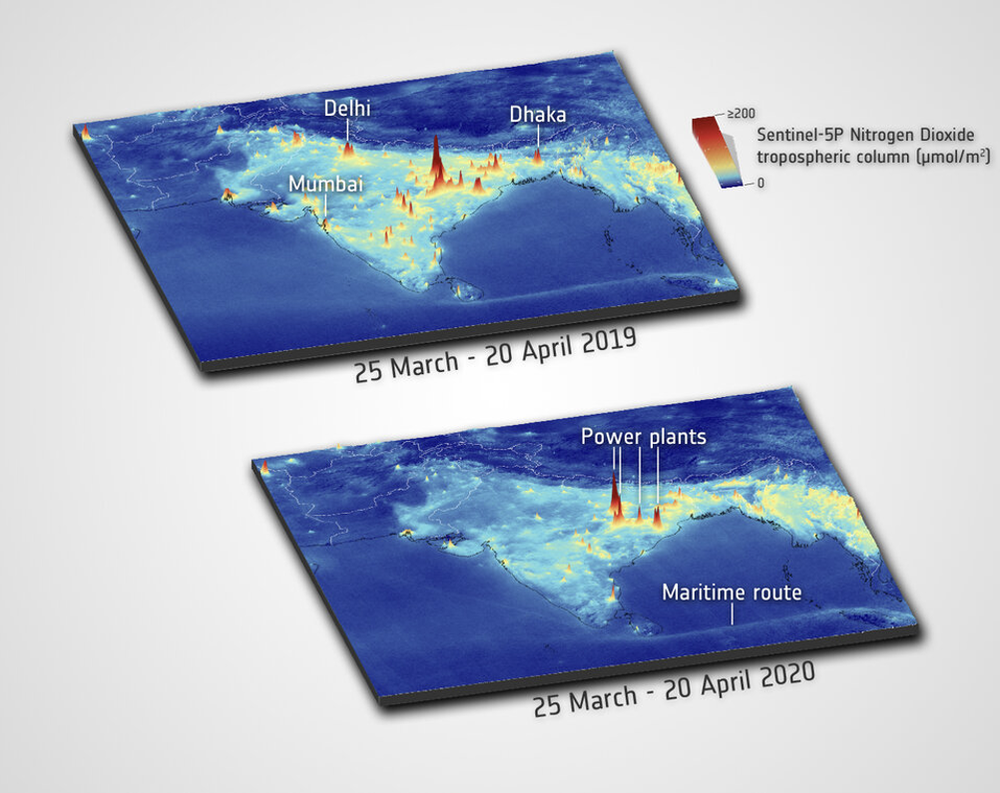
TROPOMI observations over India also showed less air pollution during lockdowns in selected cities, such as New Delhi and Mumbai. Comparing the same timeframes in 2019, averaged NO2 concentrations from the first day of the lockdown on March 25-April 20, 2020 data show reductions of about 40-50% of air pollution. However, reductions in nitrogen dioxide were not consistent throughout India. Northeast India showed nearly constant values of NO2 levels due to ongoing operations at coal-based power plants, which did not reduce electric power generation significantly during the lockdown.
In Delhi-NCR, one of the major factors that led to the drop in pollution was a 97% reduction in overall traffic and 91% reduction in trucks and commercial vehicles entering the capital during April, as compared to the pre-lockdown months of December-January,
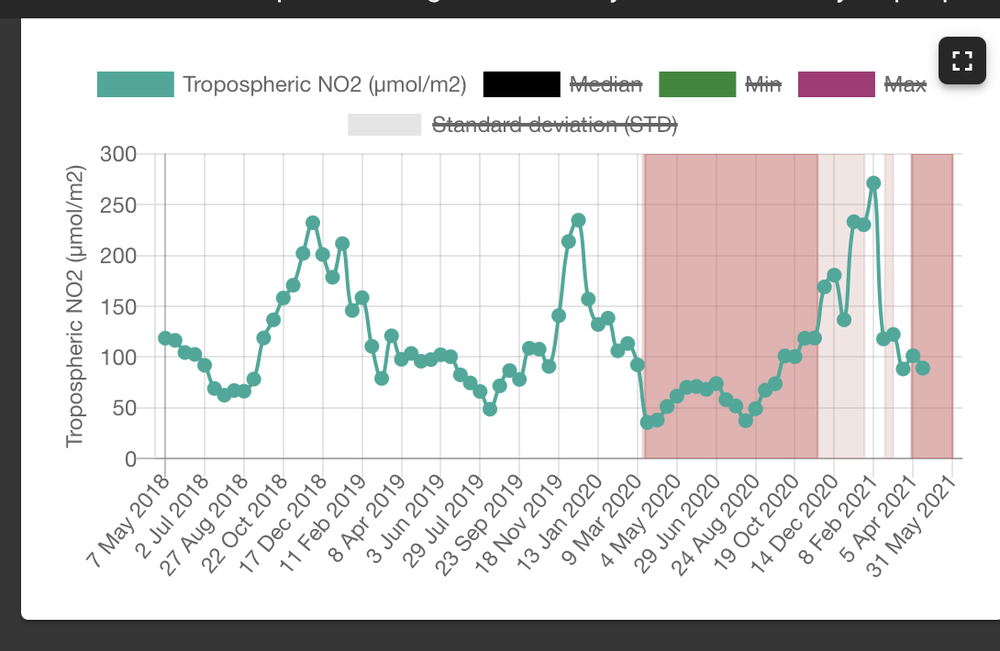
As observed in above graph,
Tropospheric NO2 as of 24th February 2020 = 113.37 before lockdown and after lock down it dropped down to Tropospheric NO2 as of 20th April 2020= 51.24.But as every things get back to normal, traffic increases, industries start operating again and On 8 February 2021 , we observe that Tropospheric NO2 rises to 271.39 Showing that how our activities damages the air we breathe.
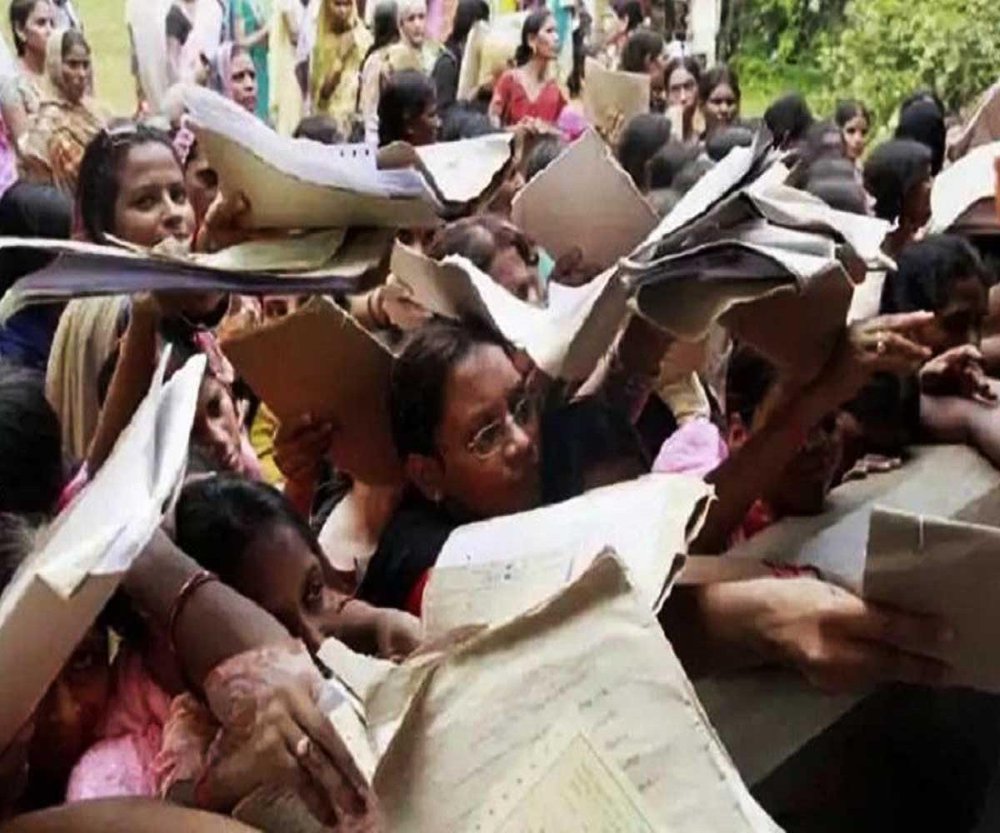
AGRICULTURE: COVID-19 has negatively affected industries across the globe. The measures implemented to try and curb the spread of the virus have disrupted business systems and routines. These measures include social distancing and lockdowns globally. Since the agricultural industry has not been exempted from the struggles that the global business market is currently experiencing.Ways by which agricultural industry has been affected:
1.UNEMPLOYEMENT: COVID-19 has led to the agricultural industry having to furlough several workers regardless of job type and level. Farmers, agronomists, veterinarians, suppliers and even clerical staff members have all been affected depending on how a particular business has decided to adapt to the pandemic. The massive dismissal of workforces is a result of the low demand for products and services, causing massive losses to businesses. Maintaining a workforce when the money being spent is more than the money earned leads to the displacement of workers.
2.RESTRICTED PRODUCT ACCESS:Borders being closed as a result of lockdowns in different countries have made it difficult for the agricultural industry to perform cross-border trading.Restricted product access also means that businesses may shift to different strategies to fulfil supply demands.

3.LACK OF PRODUCTION:Depending on the lockdown measures of a particular geographic area, agricultural workers may be required to stay at home except for when acquiring essentials. A complete stay-at-home order means that there is little to no crop production taking place. Production at lower rates results in shortages of products, affecting the ability to supply the demands of clients. If the demand for a product increases or remains unchanged, but the supply only lessens, there is bound to be an increase in its price—such is the law of supply and demand. Agriculturalists have to crucially analyze their current production methods and adapt new production methods during these difficult times.
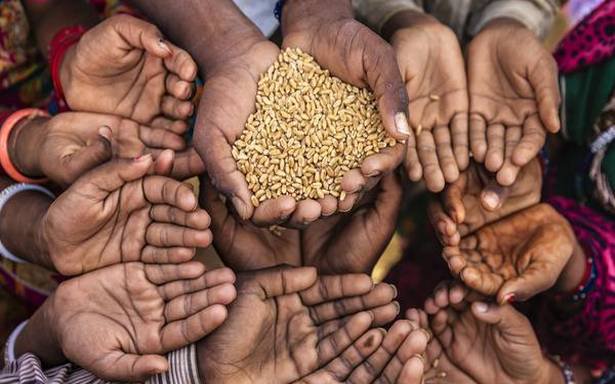
4.LOSS OF INCOME-Depending on the dynamics of the agricultural business, when there is no production, there is no income. The level of production directly influences income. This means that workers need to find alternative ways to have a source of income in order to provide for their needs at a difficult time like this. However, this is tough to do, especially when there are lockdowns in place and people have been advised to stay at home.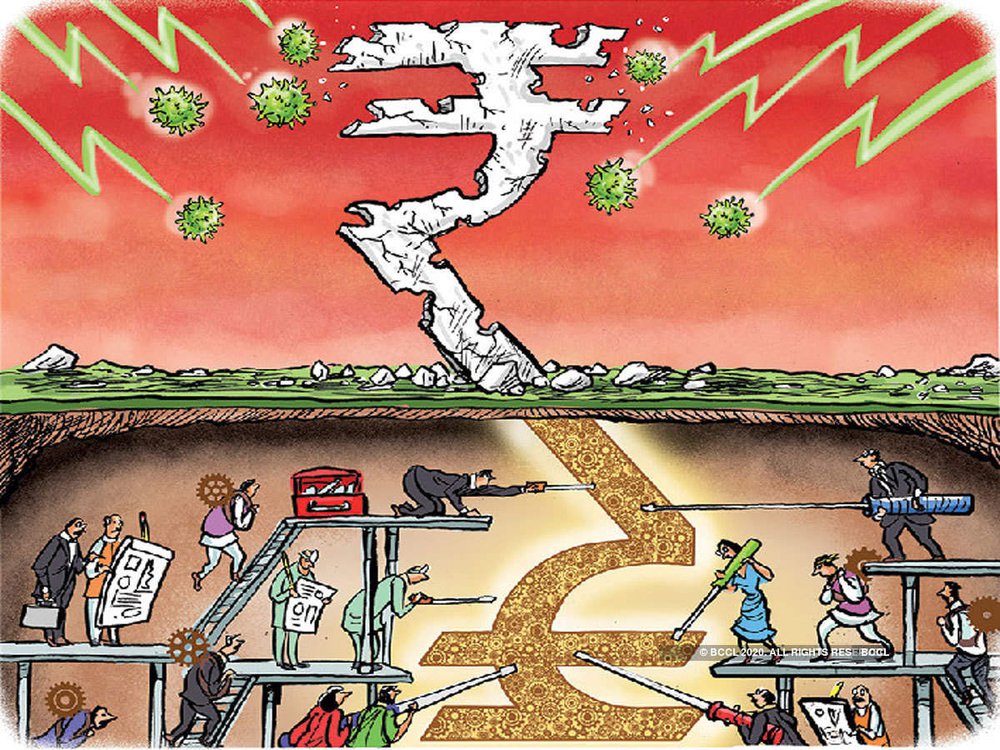
5.WASTAGE:Before COVID-19, crop production may have been abundant in anticipation of a peak supply season. The sudden change in dynamics, such as lockdown measures and client loss, resulted in a lot of produce going to waste. Fresh produce intended to be sold immediately rotted away in storage due to a low demand or restriction in exports. Wastage results to loss of income and revenue for businesses, which is difficult to negate or minimize due to the ongoing pandemic.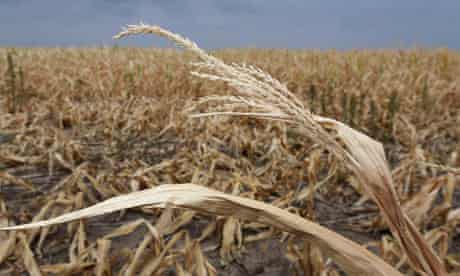
POPULATION DENSITY:The World Bank recently released findings regarding the role of urban density in the spread of COVID-19 based on evidence from China.Although some commentators equate higher population density with higher rates of infection and vice-versa,the World Bank data suggest that there’s no significant causality between the two. Further, using neighborhood testing data from New York City, our analysis amplifies the existing literature and confirms that density is only one of many factors that influence vulnerability to COVID-19.
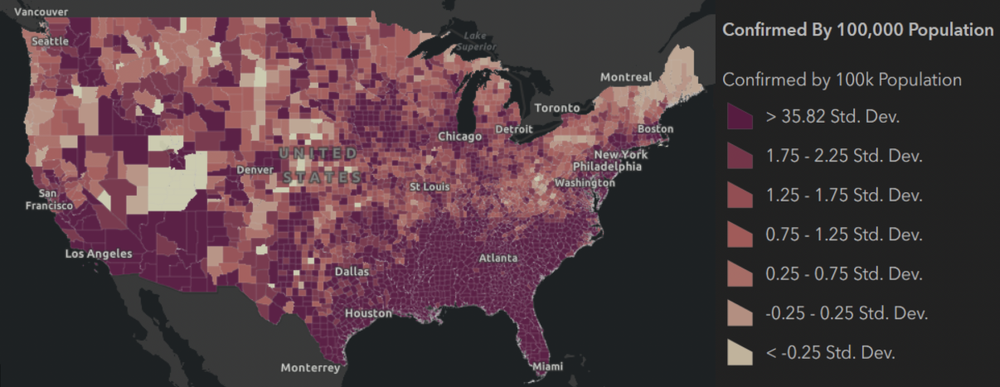
In theory, population density increases the contact rate of an individual, thereby increasing the reproduction number of the virus and leading to larger outbreaks.Other evidence, however, indicates that density is not the only factor.
Therefore, through this project we would like to shed light on positive lessons that we have learnt from this devastating pandemic and how we can use the knowledge we have gained to change our lifestyle in such a way that it doesn't harm our environment.Therefore, making living more sustainable and saving the resources for future generation.