Storytelling in the COVID-19 Era

The longer human activities are changed due to the COVID-19 pandemic, the more visible, wider, and longer lasting the scope of environmental impacts may be. Your challenge is to tell a visual story about the impacts of the pandemic using Earth observation data and other complementary information.

COVID -19: Savor The Essence of Daily Necessities

Summary

Covid-19 epidemic has had a profound impact on how people live their lives. Particularly concerning mobility, lockdown and isolation tactics limited commuting and travelling to an unparalleled degree. With such a huge shift, it is inevitable that the need for governments to reinforce well-informed policies is more than ever, with the goal of transitioning to data-driven public policy making, particularly in metropolitan regions where the incidence is higher. Our project aims to investigate how covid-19 has influenced people' everyday needs in particular areas involving mobility data such as Grocery and Pharmacy, Retail and Recreation, Parks, Transit stations, Workplace, and Residential data

How I Addressed This Challenge

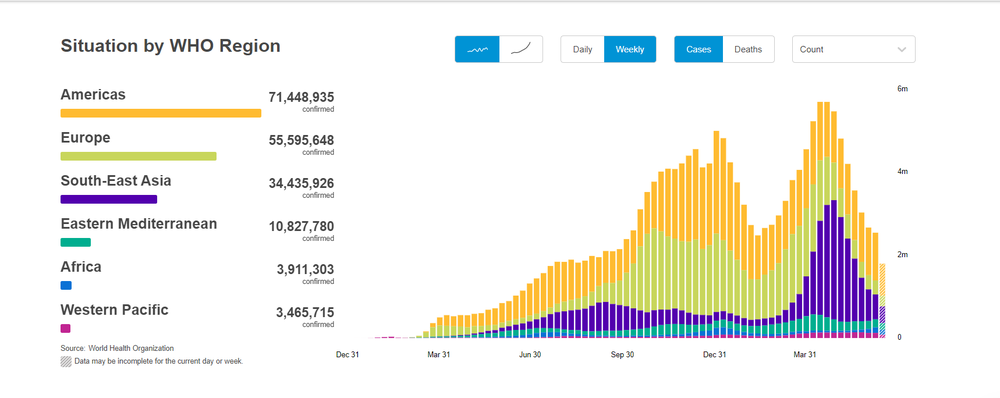
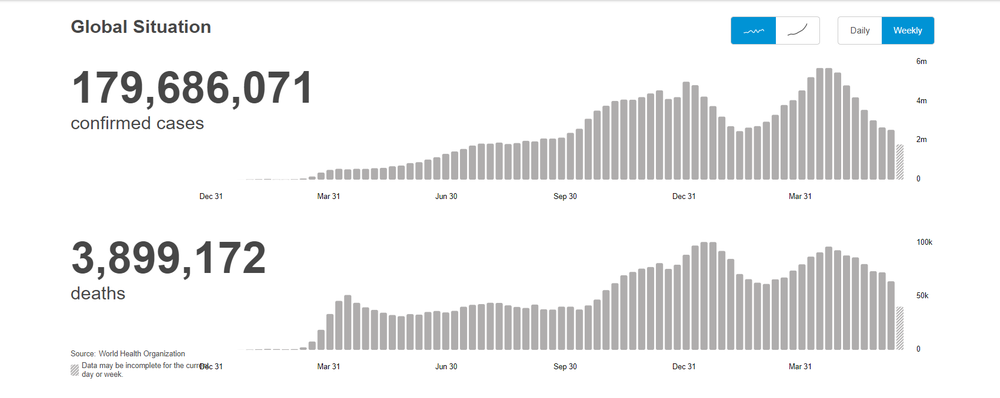
Our study is to analyze the appropriate forecasts using Google COVID-19 Community Mobility Reports and NASA dashboard data. The study aids in determining the present state of humans in mobility areas such as Grocery and Pharmacy, Retail and Recreation, Parks, Transit stations, Workplace, and Residential data. We analyzed and compared mobility data of various countries like Afghanistan, Angola, Antigua and Barbuda, Argentina, Aruba, Australia, Austria, Bahrain, Bangladesh, Barbados, Belgium, Benin, Bolivia, Bosnia and Herzegovina, Brazil, Bulgaria, Burkina Faso, United Arab Emirates from 15 February 2020 to 20 June 2021. Our investigation reveals how COVID-19 affected these individuals and produced health problems in certain areas of the countries. According to the data, several countries have experienced a rapid reduction in grocery and pharmacy requirements, which have increased more than predicted. The sum of grocery and pharmacy percent change from baseline for Brazil is the highest point of 2108439 and on the other hand Argentina has the lowest value of -1195890. Based on our definition of mobility, it follows that a research on the impact of this pandemic is not only desirable but also required in the framework of Smart Cities, especially given that we have enough historical data for the era of this pandemic. However, in order to properly display and explore data and transform it into meaningful information, several considerations must be made, such as the definition of the observed event, the toolset and structure utilized in the report, the scope of the report, the target audience, and its major objectives. Our project aims to investigate how covid-19 has influenced people' everyday needs in particular areas involving mobility data such as Grocery and Pharmacy, Retail and Recreation, Parks, Transit stations, Workplace, and Residential gathered by Google. Better dashboards and visualizations are fundamental needs for analyzing the Covid-19 issue, so that everyone can understand the terrible state of Covid-19. The total count estimated by WHO of confirmed cases is 179,686,071 with the deaths of over 3,899,172 humans. 


How I Developed This Project


“What drives me the most is helping others and empowering others. It makes no difference if the person is a coworker, a friend, or a relative. There are times when the folks around you require a little additional motivation to get moving. I am excited about the possibility of reaching out to such folks. It gives me hope and confidence that I may be of assistance. The thought that I might be able to solve someone's situation pushes me to perform a good job. It is critical to understand and sympathize with others. You don't want to make them feel inadequate or incapable of dealing with their own issues. As a solution to their problem, I merely try to show them another and less challenging way. Not only does this help them feel better, but it also allows them to reflect and think logically. I strive to be optimistic. This enables me to create the same positivity in others at a time when they are most in need of it. Giving someone a helpful hand is about making them feel happy, lively, and pleasant.”


  Grocery And Pharmacy Analysis


The structure of our project is as follows -


  1. Problem Statement: The project analyzes the critical aspect of Global data, how countries were affected in mobility categories and how they can overcome the hurdles on the way. More than 40% of countries had a major drop in these categories because of COVID-19.
  2. Data Collection: The Community Google’s mobility data used for our study and analysis. The data-driven decisions were made with respect to this dataset and analyzed various trends in data.
  3. Exploratory Data Analysis: For better data-driven decision the statistical characteristics, creating visuals of data and hypothesis testing was essential part of our project. Visual representation of data has helped many Doctors, Industrial experts and common people to analyze their current situation and to make relevant strategies for upcoming issues.  
  4. Share or Communication: To elaborate the findings of data it is important that people will be able to comprehend it easily and make better strategies for the future.


Tableau was used to generate the dashboards, SQL was utilized to sort and filter the data, and the presentation was made using the Microsoft Powerpoint application.

How I Used Space Agency Data in This Project

The data used in this project was provided from NASA dashboard and Google COVID-19 Community Mobility Reports and additional data acquired from World Health Organization. The data various prospects which have affected our day to day life right from buying groceries to fatal health issues. These characteristics have been thoroughly revised and analyzed which made accurate data-driven decisions. 

Project Demo

Demonstration of our Solution = Click Here

Earth Observing Dashboard Integration

Not Applicable

Tags

#Covid19 #Vaccines #Mobility #data #analysis #Visualization

Judging

This project has been submitted for consideration during the Judging process.