Storytelling in the COVID-19 Era

The longer human activities are changed due to the COVID-19 pandemic, the more visible, wider, and longer lasting the scope of environmental impacts may be. Your challenge is to tell a visual story about the impacts of the pandemic using Earth observation data and other complementary information.

Storytelling in the COVID-19 Era

Summary

Covid 19 is an infectious diseases caused by coronavirous. Coronavirous has made our economy, war, air and everything out of track and changed it. Our task is to describe the COVID 19 situation caused by the pandemic.

How I Addressed This Challenge

It touched the core of the heart of us to see a family who are totally unaware of the COVID 19 pandemic. Covid 19 symptoms include fever, dry cough, tiredness and less symptoms include acnes and pains, loss of taste and smell, headache etc. Hearing that heartbreaking story, we immediately took precautions to solve the problems. The solutions we provided here are effective and will work.

How I Developed This Project

The sudden change that has taken place through corona and it's terrible effect on people and how people are with this inspired us. These are the some approach to developing this challenge:

How to navigate the technical and operational uncertainties of effective responses given financial and operational limits imposed by lockdown related policies that have left even institutions in high-resource settings struggling.

How to cope with reductions in the mobility, availability and capacity of staff and partners, from head office level through to the operational front lines.

How to ensure that the immediate response to COVID-19 also takes into account longer-term development ambitions and pre-existing challenges, including the Sustainable Development Goals, climate change and fragility.

We used power point, font and photos as tools. We had achievements during the research. We learnt lots of new things, solutions of this pandemic etc.

How I Used Space Agency Data in This Project

Seeing the COVID-19 Pandemic from Space


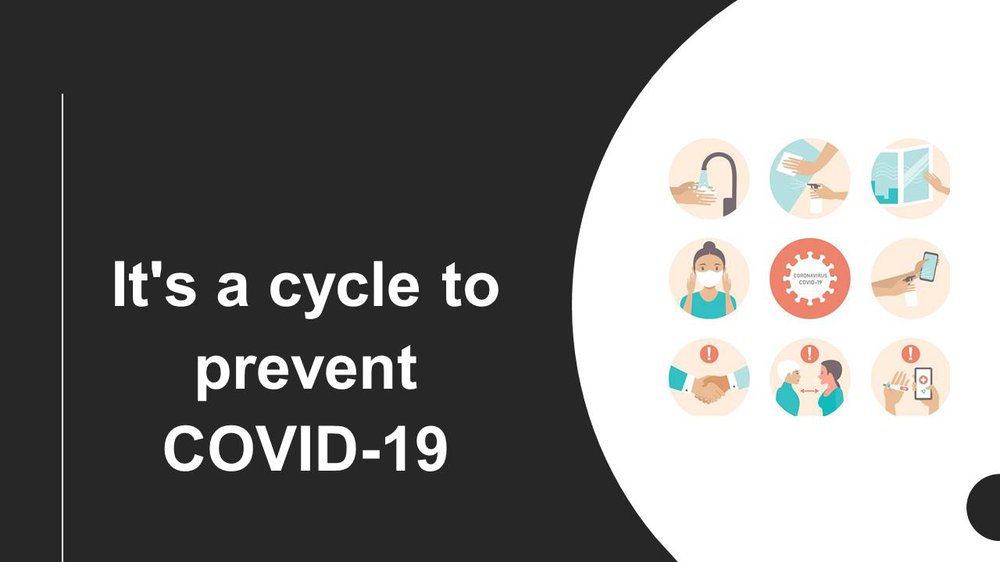
Economic and social shutdowns in response to the COVID-19 pandemic have led to noticeable changes in Earth's environment, at least for the short term. NASA researchers are using satellite and ground-based observations to track these impacts on our air, land, water and climate. These datasets have been collected in a free and openly available online dashboard.

Nitrogen dioxide (NO2), an air pollutant, decreased significantly over urban areas during the pandemic.

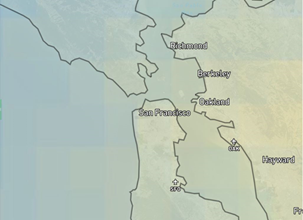
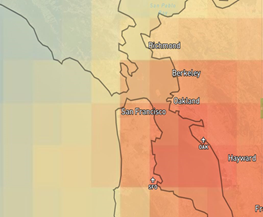
The left image above shows NO2 levels over San Francisco for the past 5 years, and the right image shows NO2 levels over San Francisco in March 2020.These data are from NASA’s Ozone Monitoring Instrument (OMI). Source: NASA COVID- 19, Dashboard.

EASA Published a special guideline for the COVID -19 pandemic

EASA published guidelines on-

1. Maintenance of ATCO skills in relation to the COVID-19 pandemic

2. On ICAO Targeted Exemptions notification process

3. Publishes updated versions of the guidelines for Aircrew and Air Operations on the use of extended         exemptions

4. Safety Information Bulletin SIB 2021-06 Vaccination of Aircrew-Operational Recommendations

5. Aeromedical Examiners regarding the examination and assessment of applicants

6. Transport andCargoin Passenger Compartments

7. On use of dry eyes in COVID-19 vaccine transportation


           Travelers should not be treated as high risk of COVID -19. Source:(EASA Guidelines)  

Project Demo


1st of all, we have to make people aware of this disease. 2ndly, we should organize funds for the covid 19 patients. 3rd, we should create more job opportunities.

Earth Observing Dashboard Integration

N/A

Data & Resources

Nasa Covid 19 dashboard

Judging

This project has been submitted for consideration during the Judging process.