What inspired your team to choose this challenge? To create the project, the team analyzed the available challenges and we choose Environmental Justice During COVID-19 pandemic, because we consider that there is a certain excluded population and we want to help through technology, locating zones.The team identified that marginalized communities have suffered various effects due to COVID-19. However, there are a lot of communities who do not have access to information about the impact of the pandemic; with this project we can share with the people the deficiencies, the conditions under which the population lives and how the virus has affected these areas. The reasons like: help communities, establish information for future generations, create new tools and transcend during the pandemic, inspired us to choose this challenge, where through technological tools and veridical information provided we can be part of the world as agents of exchange, because everyone has the right to access information.
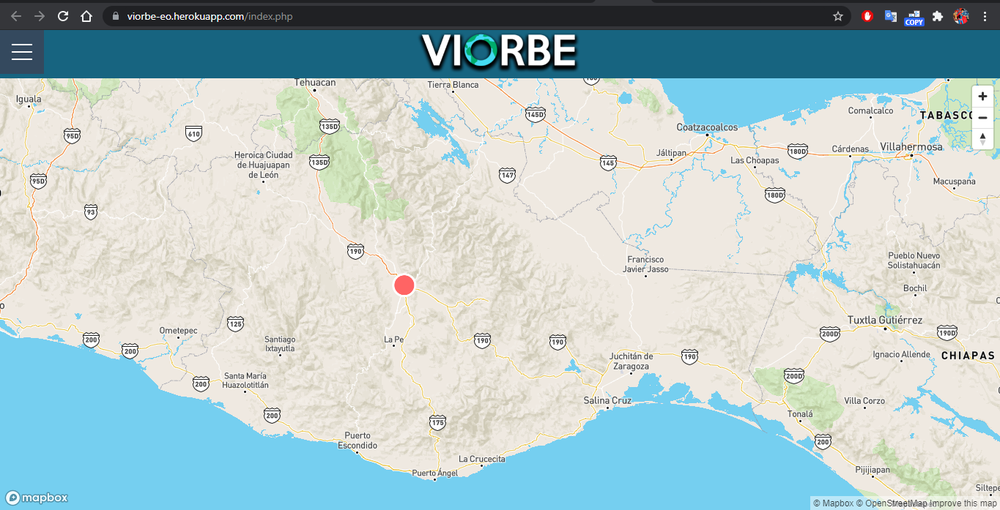
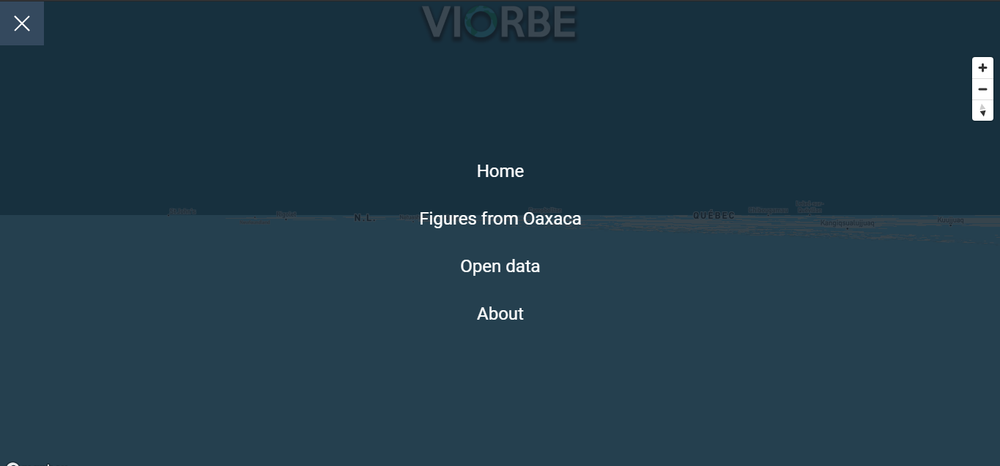
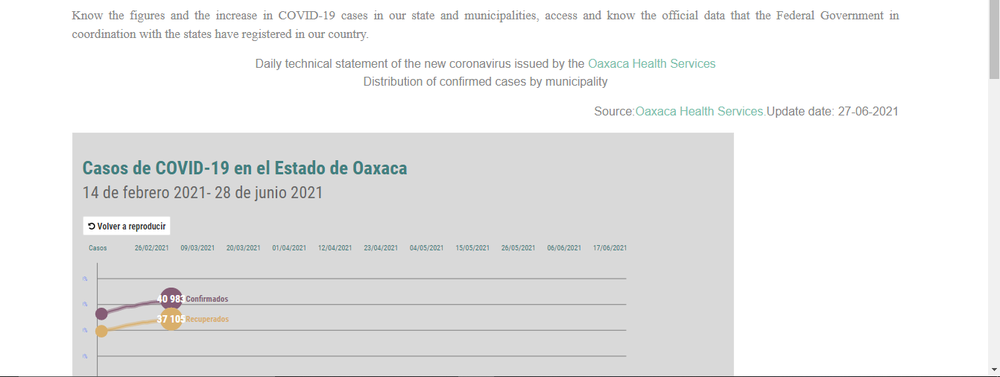
What was your approach to developing this project? We focus on marginalized communities that have been unnoticed by people. The impact of COVID19 in these areas has left consequences that must be reported, the state we chose was Oxaca in Mexico, which has had a great impact due to the pandemic. Thanks to the databases and information available we created the web application Viorbe, which is a dynamic map with useful functions according to the number of COVID19 infections. The COVID19 numbers were high, the most worrying thing is that many areas were not attended to correctly.
What tools, coding languages, hardware, software did you use to develop your project? The tools used to create the web application were Java script, HTML, CSS, MySQL and VUE.JS, the information obtained comes from data provided by EO Dashboard Hackathon.
What tools, coding languages, hardware, software did you use to develop your project? The tools used to create the web application were Java script, HTML, CSS, MySQL and VUE.JS, the information obtained comes from data provided by EO Dashboard Hackathon.