Awards & Nominations
Mind code has received the following awards and nominations. Way to go!

Mind code has received the following awards and nominations. Way to go!
The purpose of this challenge is to use remote-sensing data and satellite images to help form a better understanding of societal trends as affected by COVID-19. Your challenge is to discern how human activity in communities of minority, low-income, tribal, and indigenous populations have changed as a result of COVID-19.
In the twenty-first century, COVID-19 has become the enormous global health threat to the whole world.This pandemic has had a significant impact on almost all elements of human life, as well as the economy and health-care systems.The Project focus on the impact of Covid-19 on underserved communities of minority, low-income, tribal, and indigenous populations has changed because of COVID-19 pandemic based on the Earth observations data from NASA, ESA, and JAXA and backed by the literature.Then use these data to compile a best sales route and parking/Distribution hotspots for the relief trucks
What did you develop?
Mind Codes propose to develop an application, which can use to identify the best routes to deliver the goods and services to the doorsteps of the people by using the traffic maps, satellite data, heat maps and images of the EO Dashboard’s Covid 19 (SPM) Slow down proxy maps and (RPM) Recovery Proxy Maps.
Figure 01: Covid-19 impact seen by satellite
Source: (Aparicio, 2020)
Why is it important?
Considering the relevant articles provided by the Euro Data Cube two examples during the covid-19 pandemic, by using the data in New York and Tokyo can mention as the follow (Aparicio, Lockdown is also changing our planet at night, 2021).
Ex: New York City (Aparicio, Building traffic maps with space data, 2020)
“Taking New York City as a spotlight example. Around March 2020 in hopes of slowing the growing outbreak of the coronavirus, gatherings of more than 500 people were banned. The iconic Broadway initially posed to ‘going dark’ for a month, has ‘gone’ dark for a year now as spectacle industry stopped. Although it is not visible considerable changes in the heart of NYC, the outskirts show a considerably darkening. On the nightlight map below, the darker shades show places with less light while the lighter shades of yellow are areas with more light — allowing to monitor both the magnitude and signature of nighttime phenomena and anthropogenic sources of light emissions.” (Aparicio, Building traffic maps with space data, 2020)
Figure 02: New York Night Light Satellite Images
Source: (Aparicio, Lockdown is also changing our planet at night, 2021)
Ex: Tokyo City (Aparicio, Building traffic maps with space data, 2020)
“The vibrant city of Tokyo, while some areas seemingly remain unchanged, others revealed a decrease in lights at night. Japan’s virus state of emergency is significantly looser than lockdowns elsewhere in the world. It largely calls for more people to work from home and for bars and restaurants to shut from 8 p.m. In December, amid COVID-19 surge, the city has urged restaurants and bars to shut early, and a new state of emergency putting the upcoming Olympics at stake.” (Aparicio, Lockdown is also changing our planet at night, 2021)
“Dimmer lights during December’s state of emergency were most noticeable in the surroundings of the central Tokyo. As example, Shibuya City a major commercial and finance center, housing the two busiest railway stations in the world, shown in some areas decreasing light due to the imposed closing hours. However, overall change in lights are not so obvious in most parts, as bars for instance are too small and difficult to detect using monthly averaged data.” (Aparicio, Lockdown is also changing our planet at night, 2021)
Figure 03: Tokyo Night Light Satellite Image
Source: (Aparicio, Building traffic maps with space data, 2020)
Figure 04: Tokyo Nightlight Comparison of Satellite Images
Source: (Aparicio, Lockdown is also changing our planet at night, 2021)
When exploring the above two examples, it justify that, during the lockdown period many of the stores, shops, restaurants and all the other services has been closed down and it has affected community in a negative way which emphasized on lack of stored goods, emergency services requirements and any other need or a service. Supplying the goods and services for the people is highly essential and a prioritized activity confirmed by all the governments across the world.
Through the application, which was mentioned under the project, create a high impact when opening or relocating delivery services to the communities to their doorsteps. Everyone regard of their wealth/income/race has the equal opportunity to buy products from relief salespersons. Because of this, these salespersons cannot sell their products for an insanely high price because their target customers are not only wealthy people.
What does it do?
Provide relief salespersons best sales routes and best parking hotspots so that they can maximize their sales and utilize their services in a positive way.
How does it work?
It uses dashboard mobility data before and after the pandemic to determine places people most comfortable to gather. Then categorize these hotspots using government provide data like , how many houses does one hotspot cover, distance between houses and these hotspots, difficulty of approaching these areas, etc. give each hotspots necessary parking time according to above data. Make the best sales routes that cover these hotspots and parking time.
“The method exploits an effect related to the Sentinel-2 Multispectral Instrument (MSI) geometry. Sentinel-2 does not see a moving truck once but three times in the red-blue-green wavelengths. As the truck keeps traveling during this short time offset, it appears spectrally disassembled. This pattern may be used for detecting roaming trucks on roads. Although visual inspection cannot confirm that the objects are trucks, this is implied by the ratio between size of different vehicles and a Sentinel-2 pixel. The blue dots in the picture below are examples of identified trucks. You can find more information about this methodology developed by Henrik Fisser the winner of the custom script contest.” (Aparicio, 2020).
Figure 05: The maps of detected trucks.
Source: (Aparicio, 2020)
What do you hope to achieve?
Mind Codes team aim to achieve, a stable and a sustainable solution to deliver the goods and services to the communities by maintain service quality, hygiene factor and facing the global pandemic challenge of Corona Virus with a unique method. Also to uplift the people’s lives and work for a better tomorrow.
What inspired your team to choose this challenge?
In 2020, with the rise of novel coronavirus pandemic, millions of world population placed under home quarantine to prevent the spread of the virus, with that the behavior of people noticeably and drastically changed. Therefore, we wanted to examine this critical issues related to the pandemic and to provide resourceful analysis to better understand the challenges. Moreover, we focused on using NASA, ESA and JAXA data and also satellite-view of the effects that COVID-19 is having on our economy and human activities.
An Analysis for the inspiration to select the topic can mention as the below.
1. Mobility Data
The Mobility data indicate the information generated by activity and event with the use of digitally enabled mobility services or devices.
The Mobility data analysis covers the following categories:
1.1 Countries
1.1.1 South Korea
Figure 06: South Korea- Mobility Changes-June24,2021
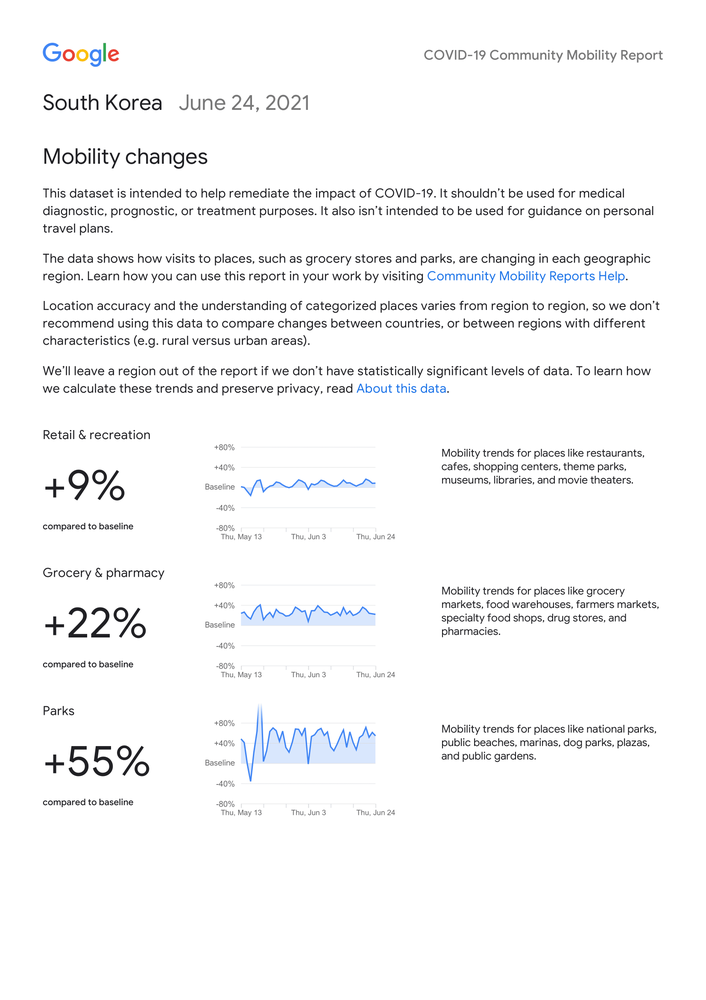
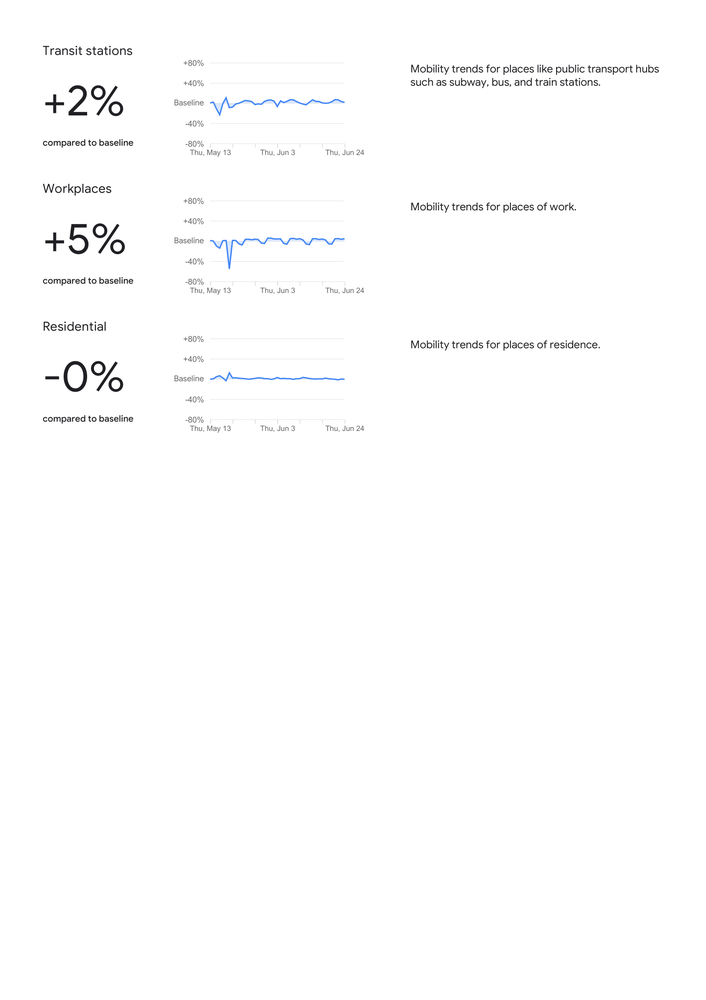
source: (Covid-19 Community Mobility Report, 2021)
Figure 07: Seoul- Capital South Korea-Mobility data June24, 2021
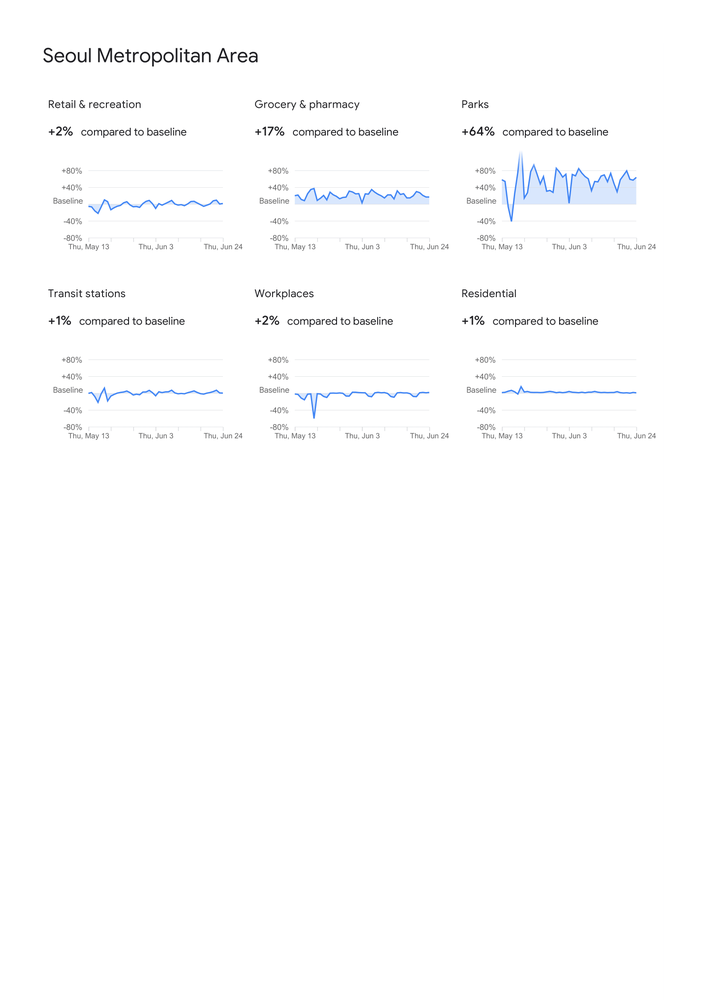
source: (Covid-19 Community Mobility Report, 2021)
Accordingly, recent data show an increase compared to the baseline in the mobility data categories in South Korea, with that it can be concluded that the impact of COVID-19 considerably minimized.
Moreover, according to figure 07, the Capital of South Korea, Seoul shows a visible increase of 64% in the category- Park compared to the baseline. Following that Grocery & Pharmacy category increased by 17% compared to the baseline. While Retail, Transit station and Workplaces show 1% growth the Residential category shows a growth of 1%.
1.1.2 Singapore
Figure 08: Singapore- Mobility Changes-June23,2021
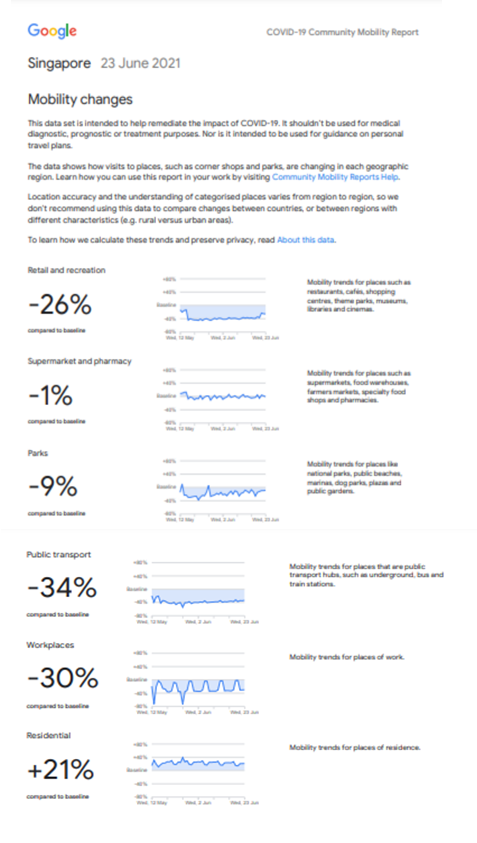
Source: (Covid-19 Community Mobility Report, 2021)
According to figure 08, Singapore shows a visible decrease in most of the categories. Only the Residential category shows a 21% increase compared to the baseline. Moreover, the public transport category shows the main decrease of 34% compared to the baseline. Following that Workplaces and Retails shows 30% and 26% decrease respectively.
2.0 Economic Trends
Under Economic trends, Activity (Car/ Containers), Slowdown Proxy Maps (SPM) and Recovery Proxy Maps (RPM) will be analyzed.
2.1 Country
Considering the availability of Data,
2.1.1 Activity (Car/ Container)
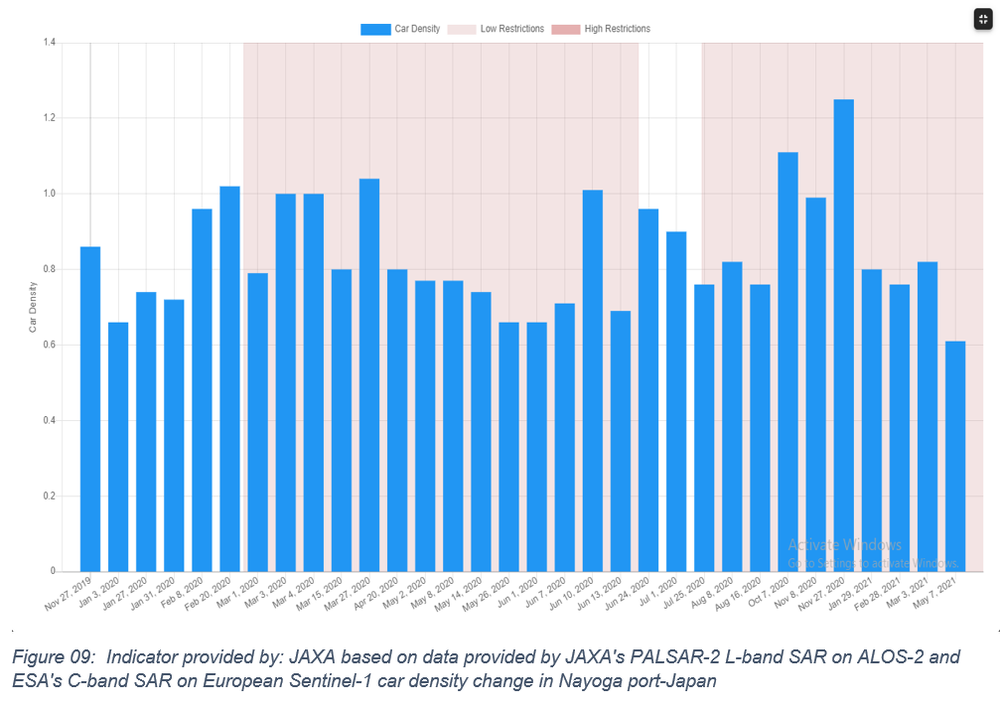
2.1.1.1 Japan- Nagoya port
The Port of Nagoya, situated at the innermost edge of Ise Bay, which is located at the center of the Japanese Archipelago facing the Pacific Ocean, has steadily grown since it opened for international trade on Nov. 10, 1907.
The Port of Nagoya handles all types of cargo (general, container, bulk, etc.) and is the largest port in Japan in terms of total cargo throughput, reaching 197 million tons in 2018, according to the Port of Nagoya Authority. In addition, the Port of Nagoya leads in Japanese automobile exports: approximately 1.4 million completed automobiles move through there annually.
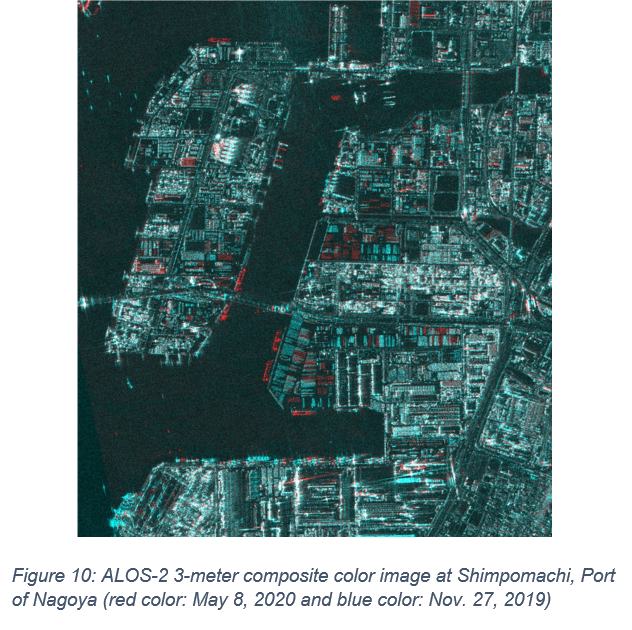
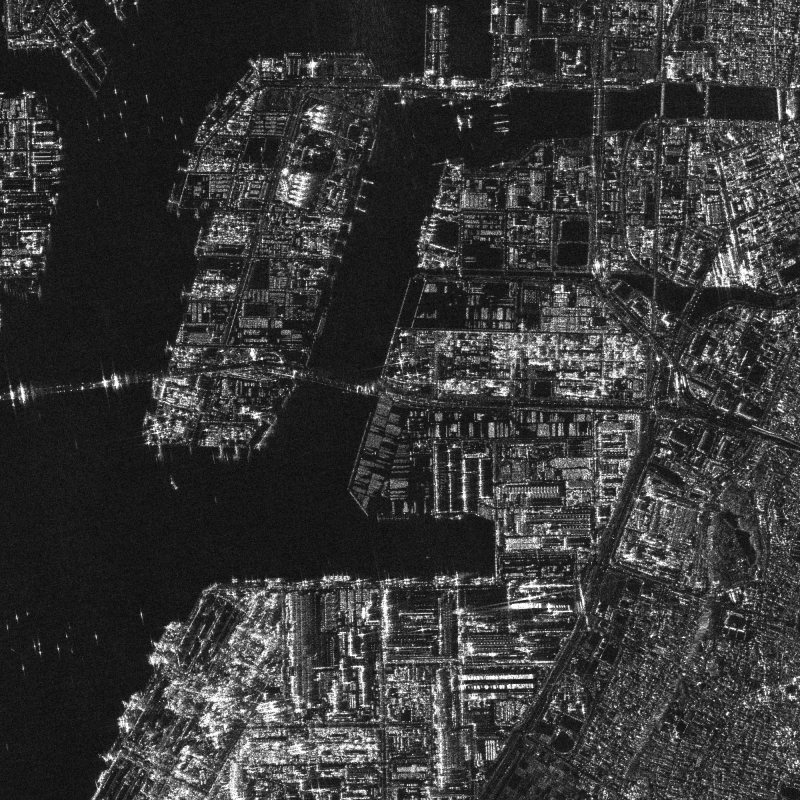
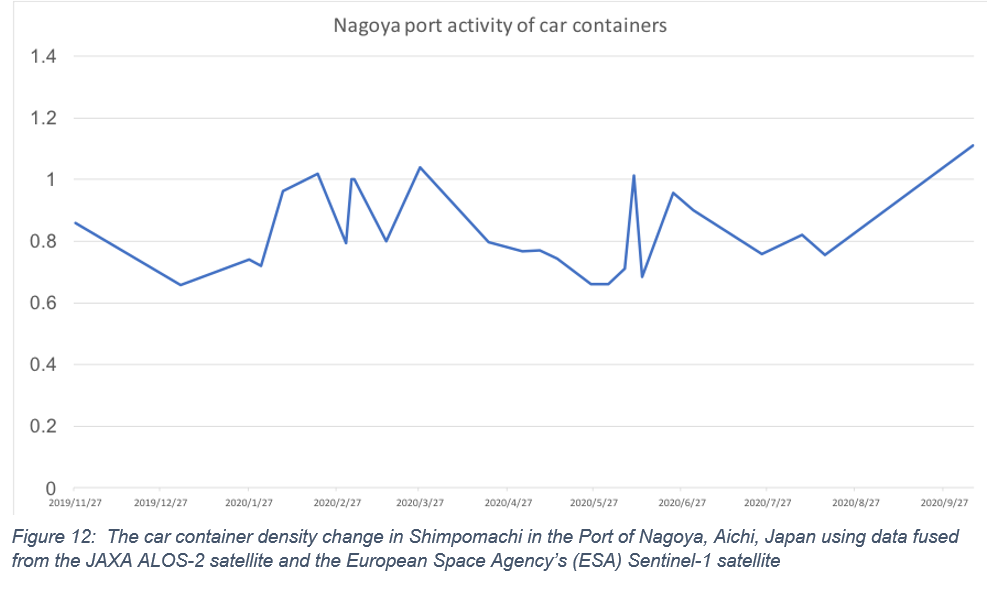
From November 2019 to June 2020, the Japanese Aerospace Exploration Agency’s (JAXA) ALOS-2 satellite observed the density of car containers at Shimpomachi Terminal in the port of Nagoya to monitor the condition of industrial trade. During the novel coronavirus pandemic, ALOS-2 observations show that shipments of new cars decreased.
2.1.1.2 China-Beijing port
Change in the number of new car at automobile factory
All over the world, countries have taken measures to reduce the spread of the coronavirus, such as urban lockdowns or stay-at-home requests due. Automotive manufacturers around the world also have taken steps, such as adjusting, reducing and suspending new car production.
Figure 13: The combined data from PALSAR-2, which uses L-band SAR mounted on JAXA's ALOS-2, and C-band SAR
The combined data from PALSAR-2, which uses L-band SAR mounted on JAXA's ALOS-2, and C-band SAR mounted on the European Sentinel-1, tracks production and movement at factories and ports importing and exporting cars to monitor the increase and decrease of new car production.
During the lockdown in Beijing, from January to March 2020, the density of new cars dropped significantly.
What was your approach to developing this project?
Since the selected topic is concern about the “Environmental Justice during the Covid-19 Pandemic” the topic has divided into sub areas such as, Societal Trends, Impact on Covid-19 on parking trend, air pollution levels, food supply chain and water quality which cause to address the topic of the project more wider.
Some relevant details are gathered and quoted through open sources as the follow regarding to the sub areas which are discussing under the selected topic for the project.
1. Societal Trends
1.1 Older Persons
Older persons are particularly susceptible to the risk of infection from COVID-19, especially those with chronic health conditions such as hypertension, cardiovascular disease and diabetes.
Older persons are not just struggling with greater health risks but are also likely to be less capable of supporting themselves in isolation. Although social distancing is necessary to reduce the spread of the disease, if not implemented correctly, such measures can also lead to increased social isolation of older persons at a time when they may be at most need of support.
The discourse around COVID-19, in which it is perceived as a disease of older people, exacerbates negative stereotypes about older persons who may be viewed as weak, unimportant and a burden on society. Such age-based discrimination may manifest in the provision of services because the treatment of older persons may be perceived to have less value than the treatment of younger generations. International human rights law guarantees everyone the right to the highest attainable standard of health and obligates Governments to take steps to provide medical care to those who need it. Shortages of ventilators, for example, necessitate the adoption of triage policies and protocols based on medical, evidence-based and ethical factors, rather than arbitrary decisions based on age. (Everyone Included: Social Impact of Covid-19, 2021)
1.2 Persons with Disabilities
Even at the best of times, persons with disabilities face challenges in accessing health-care services, due to lack of availability, accessibility, affordability, as well as stigma and discrimination. The risks of infection from COVID-19 for persons with disabilities are compounded by other issues, which warrant specific action: disruption of services and support, pre-existing health conditions in some cases which leave them more at risk of developing serious illness or dying, being excluded from health information and mainstream health provision, living in a world where accessibility is often limited and where barriers to goods and services are a challenge, and being disproportionately more likely to live in institutional settings. (Everyone Included: Social Impact of Covid-19, 2021)
General individual self-care and other preventive measures against the COVID-19 outbreak can entail challenges for persons with disabilities. For instance, some persons with disabilities may have difficulties in implementing measures to keep the virus at bay, including personal hygiene and recommended frequent cleaning of surfaces and homes. Cleaning homes and washing hands frequently can be challenging, due to physical impairments, environmental barriers, or interrupted services. Others may not be able to practice social distancing or cannot isolate themselves as thoroughly as other people, because they require regular help and support from other people for every day self-care tasks. (Everyone Included: Social Impact of Covid-19, 2021)
1.3 Indigenous Peoples
Indigenous peoples are particularly vulnerable at this time due to significantly higher rates of communicable and non-communicable diseases, lack of access to essential services, absence of culturally appropriate healthcare, and if any, under-equipped and under-staffed local medical facilities. (Everyone Included: Social Impact of Covid-19, 2021)
The first point of prevention is the dissemination of information in indigenous languages, thus ensuring that services and facilities are appropriate to the specific situation of indigenous peoples, and all are reached.
The large number of indigenous peoples who are outside of the social protection system further contributes to vulnerability, particularly if they are dependent on income from the broader economy – produce, tourism, handicrafts and employment in urban areas. In this regard, Governments should ensure that interim financial support measures include indigenous peoples and other vulnerable groups. (Everyone Included: Social Impact of Covid-19, 2021)
2. Impact of Covid 19 on parking trends (LeFurgy, 2021)
“Quarantines and business shutdowns fueled by the COVID-19 pandemic have led to a dramatic decrease in parking demand. Subsequently, many sectors of the economy that depend on parking revenue are facing budget shortfalls this year.
Spothero.com reported in 2020 that the parking industry saw parking volumes in many areas fall by up to 97%, resulting in job losses and furloughs for 50% of the industry’s workforce. Commuter lots had a 50% to 70% reduction in use, while visitor lots saw up to a 95% drop from the same time the previous year, according to a survey by Smarking, a parking software company.
Municipalities are scrambling to recover not only lost parking income but also a dramatic reduction in revenue from fees and fines. A 2019 CarRentals.com survey of parking data for 16 major U.S. cities found that they collected a total of $1.4 billion in annual parking ticket revenue. In 2019, Chicago issued 2.06 million parking tickets. Through June 30 of 2020, the city gave out less than 500,000. New York City projected that it would lose $600 million in parking revenues in 2020.
Lost income from fees and fines, which is typically put into the general fund to support government operations, debt financing, and water and sewer services, will place additional challenges on cities as they attempt to rebound from the pandemic.
The International Parking and Mobility Institute (IPMI) conducted a benchmark survey in 2020. It confirmed that most academic institutions, airports, municipalities and health care facilities expect to experience significant budgetary shortfalls this year, with a substantial factor being the reduction in parking revenue. Educational institutions, which transitioned to almost 100% virtual learning during the pandemic, cited permit refunds and temporary suspension of parking enforcement as having an enormous impact on revenue generation. According to additional research by planning and design engineer consultants Kimley-Horn, airports were among the hardest hit, and parking revenue was down 95% due to travel restrictions.” (LeFurgy, 2021)
3. Impact of Covid 19 on air pollutant levels (Gope , Dawn, & Das, 2021)
“The COVID-19 pandemic has significantly affected economic activities all around the world. Though it took a huge amount of human breathes as well as increases unemployment, it puts a positive impression on the environment. To stop the speedy extend of this disease, the maximum Government has imposed a strict lockdown on their citizens which creates a constructive impact on the atmosphere. Air pollutant concentration has been investigated in this study to analyze the impact of lockdown on the environment. Based on the air pollutant concentration, Air Quality Index (AQI) is deliberated. The Air Quality Index indicates the most and least polluted cities in the world. A higher value of AQI represents the higher polluted city and a lesser value of Air Quality Index represents a less polluted city. The impact of lockdown on air quality has been studied in this work and it is observed that the air pollutant concentration has reduced in every city of the world during the lockdown period. It has been also detected that the PM2.5 and PM10 are the most affecting air concentrator which controls the air quality of all the selected places during and after lockdown.” (Gope , Dawn, & Das, 2021)
4. Impact of Covid-19 on Food production trends (Food Supply Chain) (Aday & Aday, 2020)
“A pandemic is not a new event encountered in the history of humanity because mankind has faced various pandemics in history. The common point of pandemics is their serious negative effects on the global economy. Considering the food supply chain, one of the most important sectors of the economy, it has been seen that COVID-19 has an impact on the whole process from the field to the consumer. In the light of recent challenges in food supply chain, there is now considerable concern about food production, processing, distribution, and demand. COVID-19 resulted in the movement restrictions of workers, changes in demand of consumers, closure of food production facilities, restricted food trade policies, and financial pressures in food supply chain. Therefore, governments should facilitate the movement of workers and agri-food products. In addition, small farmers or vulnerable people should be supported financially. Facilities should change the working conditions and maintain the health and safety of employees by altering safety measures. Food protectionist policies should be avoided to prevent an increase in food prices. In conclusion, each country must realize the severity of the situation and sometimes should tighten or loosen the measures according to the spread of the pandemic. The supply chain also should be flexible enough to respond to the challenges in the food supply chain. The purpose of this review is to evaluate the impact of COVID-19 on the agriculture and food sector and to summarize the recommendations required to reduce and control the effect of the pandemic.
Consumers generally do not think much about how the food on their tables is produced. However, concerns about food safety in the midst of the global pandemic have drawn attention to the enormous infrastructure and workforce responsible for creating a safe and reliable food supply worldwide. Especially at the beginning of this global crisis, consumer demand for food has increased and some store shelves have been temporarily emptied and resulted in excess purchases of essential products. However, despite this unprecedented demand, the food supply chain remained strong, since many supply chain actors, including farmers, producers, distributors, and retailers, have worked hard to renew shelves (Nicola et al., 2020; Watts, 2020).
Despite the large scale of the pandemic, there is no report that COVID-19 has been transmitted through food consumption to date. Therefore, as stated by the European Food Safety Authority, there is no evidence that food poses a risk to public health in relation to COVID-19. However, after the latest infections have been seen in Xinfandi market due to salmon processing, it can be concluded that the risk of the virus that transmitted through foods is lower than the perceived risk. Considering the survival time of SARS-CoV-2 in different environments such as plastic, steel, or cardboard, it is possible that animal tissues (meat, fish, or poultry) might be a serious source for foodborne transmission. Hygiene controls by food business operators are designed to prevent contamination of food by any pathogen and will therefore aim to prevent contamination of foods by the virus responsible for COVID-19 too (Arellano, 2020; Dalton, 2020; EC, 2020; Pressman et al., 2020). It was reported that foods were not a source of spread of coronaviruses including MERS and SARS-CoV due to the acidic environments of the stomach (pH < 3.5) in previous outbreaks. However, some cooking and eating habits may lead to the reappearance of the coronavirus from animals to humans (Rizou et al., 2020).” (Aday & Aday, 2020)
5. The Impact of Covid-19 on Water Quality
During lockdown periods, the major industrial sources of pollution affecting aquatic ecosystems (such as industrial wastewater, crude oil, heavy metals, and plastics) decreased or completely stopped, resulting in reduced levels of pollution — and this can be observed from Space using satellite data. (Aparicio, Coronavirus and Water Quality -what's the correlation?, 2020)
Figure 16: San Francisco, USA
Source: (Aparicio, Coronavirus and Water Quality -what's the correlation?, 2020)
Figure 17: Chl-a anomaly (%) Dan Francisco before (2020/03/02) and during lockdown periods (2020/04/03)
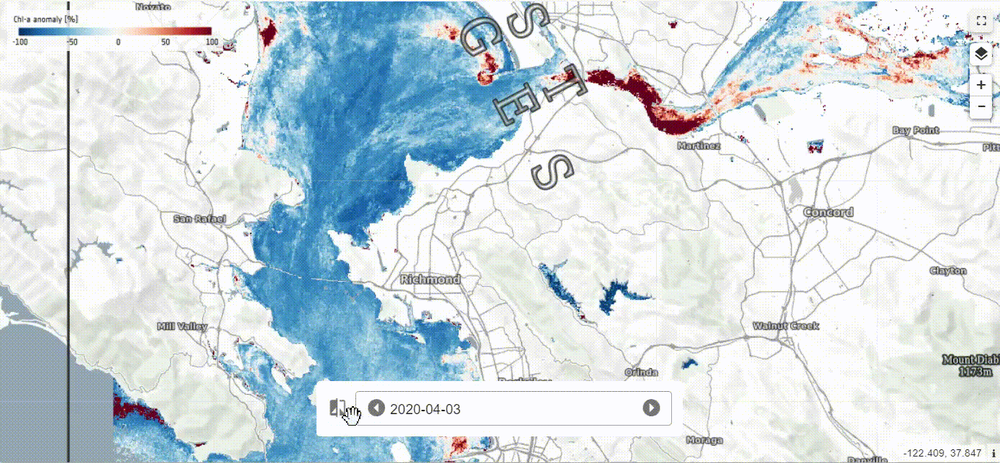
Source: (Aparicio, Coronavirus and Water Quality -what's the correlation?, 2020)
“For example, if you go explore Venice lagoon (where Covid-19 outbreak brought tourism to a screeching halt leading to a decrease of Chl-a as result of decrease of maritime traffic) the map will load satellite data provided from three different satellites, allowing for a denser observation by combining the views from the 3 agencies.” (Aparicio, Coronavirus and Water Quality -what's the correlation?, 2020)
Figure 18: Venice Covid-19 outbreak
Source:(Aparicio, Coronavirus and Water Quality -what's the correlation?, 2020)
Figure 19: Venice Covid-19 Outbreak
Source:(Aparicio, Coronavirus and Water Quality -what's the correlation?, 2020)
Figure 20: Theconcentration of Chl-a during 2020 with the average values over the 2017–2019 period.
Source: (Aparicio, Coronavirus and Water Quality -what's the correlation?, 2020)
Figure 21: Several datasets available for different locations: (LEFT) Rhone delta — Total suspended matter anomaly (%) (RIGHT) Tokyo Bay — Total suspended matter anomaly (%)
What tools, coding languages, hardware, and software did you use to develop your project?
What problems and achievements did your team have?
Achievements:
Problems:
The data sources were directly used to analyze the project requirements. All the collected from NASA, ESA , JAXA, and other open sources applied relevantly to the each segment that has to discuss in the project. The clear descriptions and the details infused in the articles has been the main reason to uplift the quality of the project according to the accepted level and standard of EO Dashboard Hackathon 2021 and Team, Mind Codes.
Please download the "Mind_Code_Presentation.pptx" for full experience. Because this slideshow include animations.
https://drive.google.com/file/d/1n1G-YJNPT7FAINpdam8AgdDZVlqyonU2/view?usp=sharing
Mind Codes propose to develop an application, which can use to identify the best routes to deliver the goods and services to the doorsteps of the people by using the traffic maps, satellite data, heat maps and images of the EO Dashboard’s Covid 19 (SPM) Slow down proxy maps and (RPM) Recovery Proxy Maps. This solution facilitate the local shop owners to large scale business and also NASA will be able to increase the reaches of theirsite and SEO through the application when using the satellite data to provide a sustainable service to the community.
Aday, S., & Aday, M. S. (2020, December ). Impact of Covid-19 on the fod supply chain. Food Quality and Safety, 4(4), 167-180. Retrieved from https://academic.oup.com/fqs/article/4/4/167/5896496
Aparicio, S. (2020, November 24). Building traffic maps with space data. Retrieved from Euro Data Cube : https://medium.com/euro-data-cube/building-traffic-maps-with-space-data- %EF%B8%8F-fd894a847792
Aparicio, S. (2020, December 17). Coronavirus and Water Quality -what's the correlation? Retrieved June 28, 2021, from Euro Data Cube: https://medium.com/euro-data-cube/coronavirus-and?water-quality-whats-the-correlation-bf727d343e61
Aparicio, S. (2021, March 25). Lockdown is also changing our planet at night. Retrieved from Euro Data Cube : https://medium.com/euro-data-cube/lockdown-is-also-changing-our-planet-at?night-520deffec252
Covid-19 Comunity Mobility Report. (2021, June 23). Retrieved from Google: https://www.google.com/covid19/mobility/
Everyone Included: Social Impact of Covid-19. (2021). Retrieved from United Nations : https://www.un.org/development/desa/dspd/everyone-included-covid-19.html
Gope , S., Dawn, S., & Das, S. S. (2021, May 25). Effect of Covid-19 pandemic on air quality: a study based on air quality index. Environmental Science and Pollution Research. Retrieved from https://link.springer.com/article/10.1007/s11356-021-14462-9
LeFurgy, J. (2021). Covid-19 creates a downshift in parking demand . Retrieved from NAIOP : https://www.naiop.org/en/Research-and-Publications/Magazine/2021/Spring?2021/Business-Trends/COVID-19-Creates-a-Downshift-in-Parking-Demand
#COVID-19 #Economy #Environment #Societal_Trends #Global_Pandemic #Human _Activity
This project has been submitted for consideration during the Judging process.


