We could notice that the low-income classified countries didn’t have response strategies to cope with the pandemic. So we wanted to analyze how the covid cases, vaccinations are related to other country parameters. So for this purpose, we obtained various data like GDP, CO2 emissions, Internet % of the population, Gini Index, Literacy rate, Population, Unemployment, total (% of the total labor force), Covid cases, Vaccinated, Testing to compare for the countries: Sudan, Bangladesh, Togo, Tanzania, Malawi, Brazil, Indonesia, Philipines. For analysis, we used Excel, Python, and SAS JMP to perform data analysis to obtain useful insights. Our main aim to understand the correlation of the country indicators with the Covid cases. For example, obtain the literacy rate and internet usage rate correlation with vaccination rate. In generic assumption, higher literacy and internet users must have a higher vaccination rate. And if the case is vice-versa in a country, we must highlight the scenario. Such analysis will help in government or relevant authorities to build better response strategies for the pandemic.
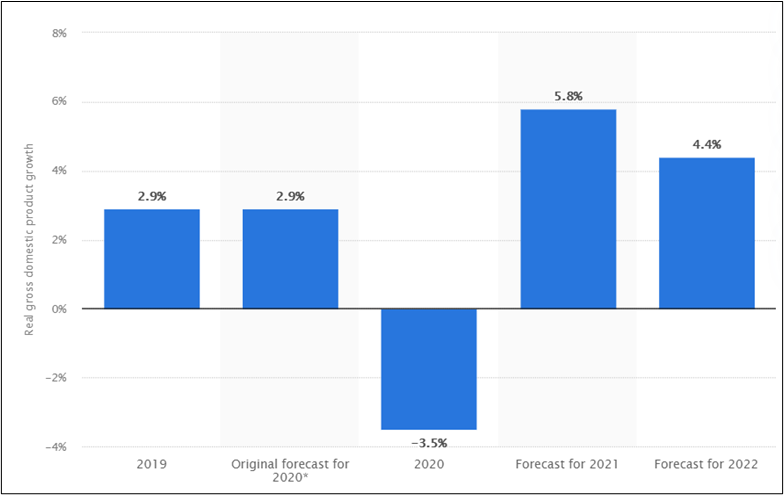
The impact of Covid 19 has been massive throughout the world. The COVID-19 global recession is the deepest since the end of World War II. Based on the graphs below, we can notice that despite the GDP forecast being 2.9%, 2020 witnessed a contraction of 3.5%.
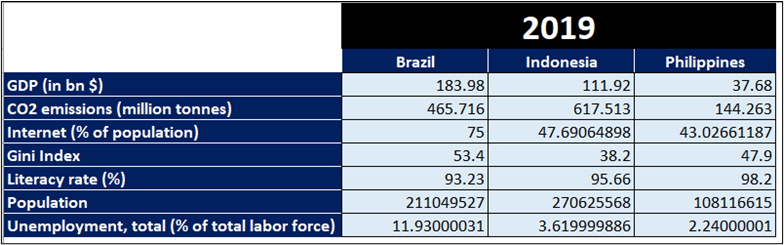
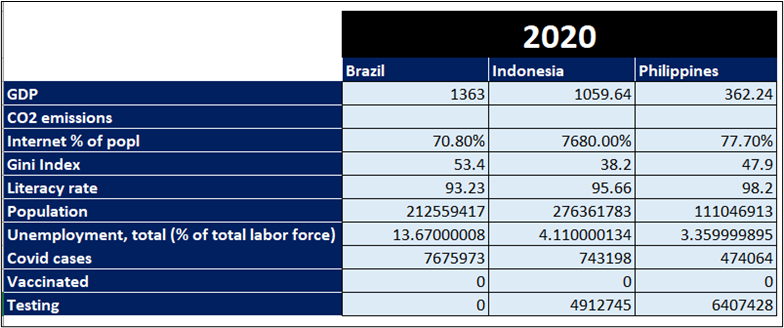
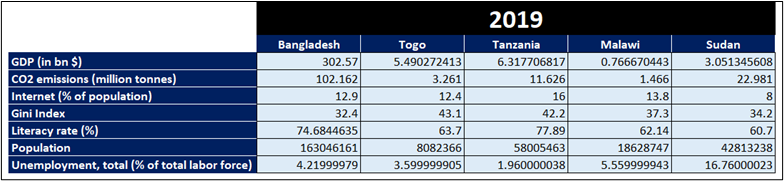
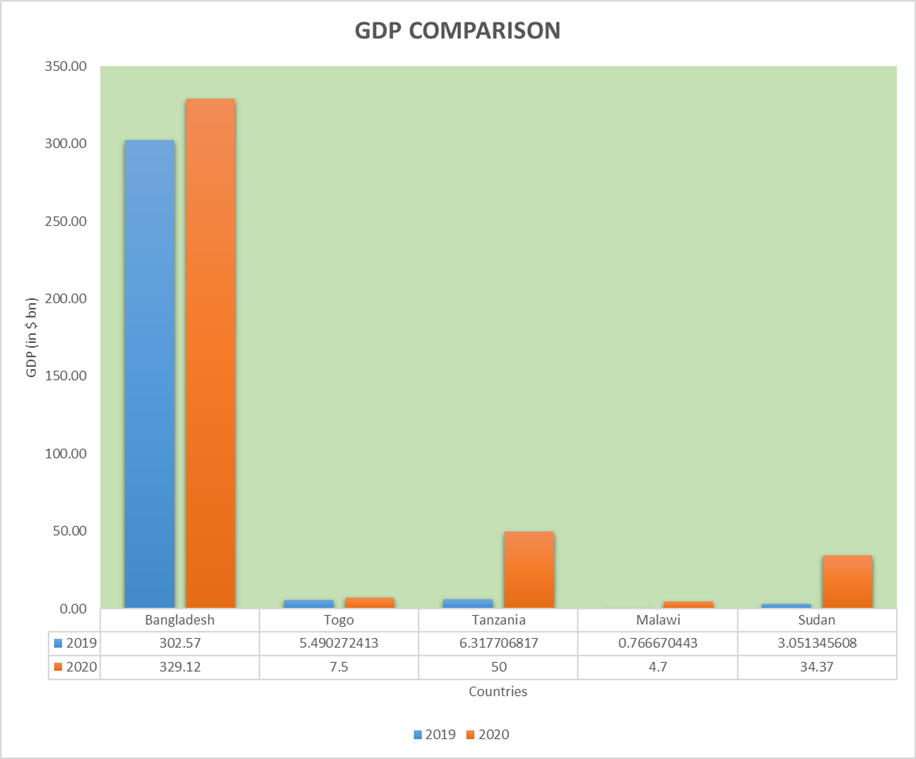
The low-income countries are facing a dual hit, with health and economic crisis. During 2020, the onset of a pandemic, the low-income countries had fewer resources to protect themselves. Based on the published sources of data, we have collected the information on various metrics as follows:
Despite this factor, the low-income countries have managed to sustain their GDP at a constant rate.
AGRICULTURE
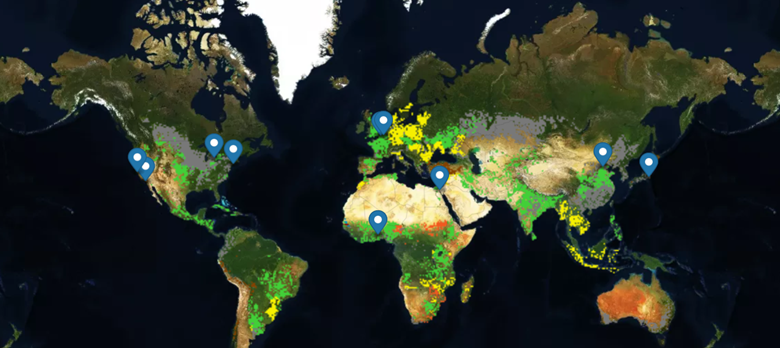
It can be evidently seen how agriculture has improved and deteriorated during 2020 all over the world. Mainly, in some parts of Africa and Australia, the agricultural sector is marked poor.
Around 255 million jobs were erased in 2020, due to pandemics. Based on world reports, approximately 95 million people are expected to have entered extreme poverty ranks. To understand the impact of Covid on every aspect of country growth, we have taken the following parameters:
1. CO2 emissions (million tonnes)
2. Internet (% of the population)
3. Gini Index
4. Literacy rate (%)
5. Population
6. Unemployment, total (% of the total labor force)
BANGLADESH
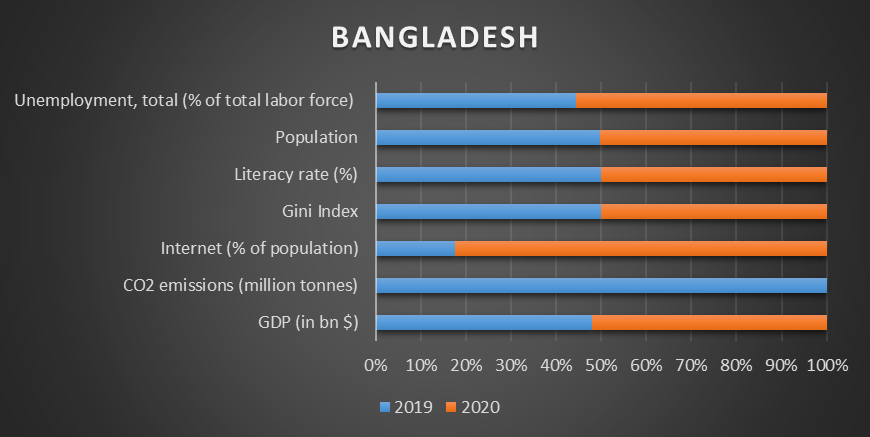
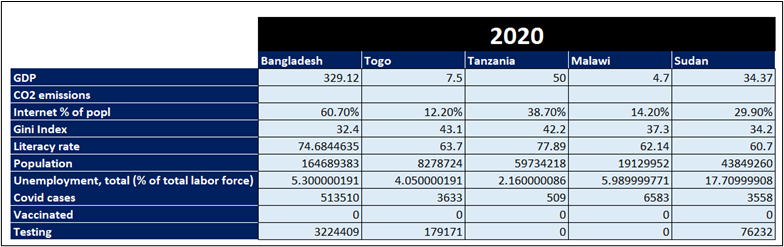
Based on the Trading Economics report, around 2 million educated people are added to the unemployed list every year. Despite the population, literacy rate, and Gini Index remaining constant across both the years, the unemployment rate has increased by 1.1%.
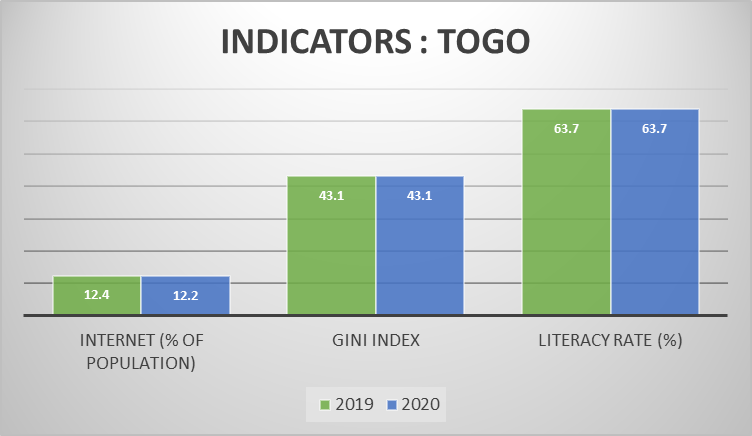
TOGO:
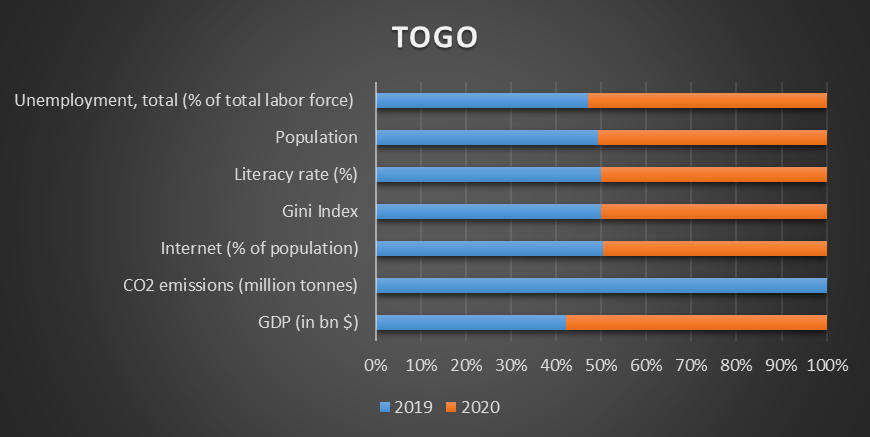
Togo is a great example of ensuring survival amidst the global recession. Despite the global financial meltdown, Togo has ensured ensuring growth and protecting jobs. The country has witnessed a small rise in its GDP. There has been job growth in the mining and agricultural sectors.
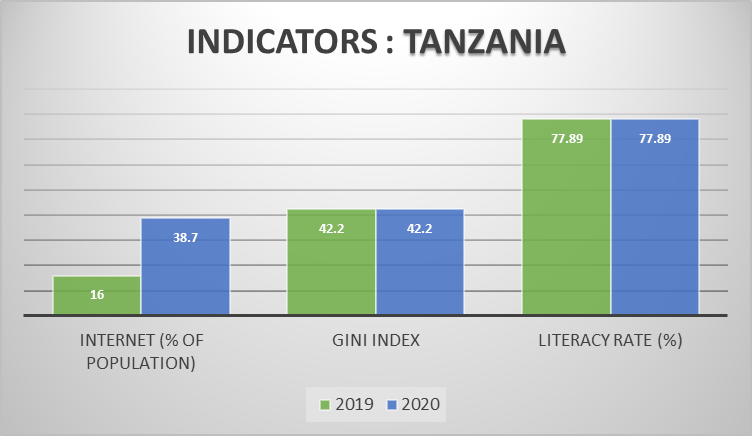
TANZANIA
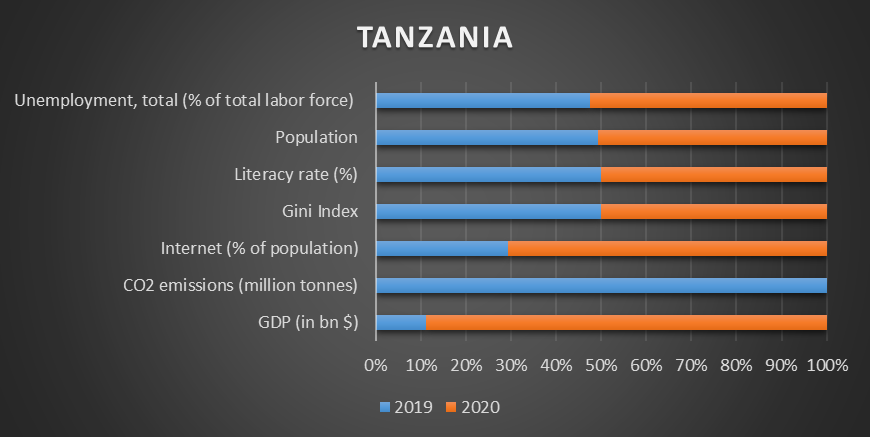
The major issues while analyzing Tanzania reports were that, many of the published data were either outdated or unavailable. The country didn’t publish the covid cases and testing data. However, the World Bank report states that the tourism and international trade market was affected heavily due to travel bans during 2020.
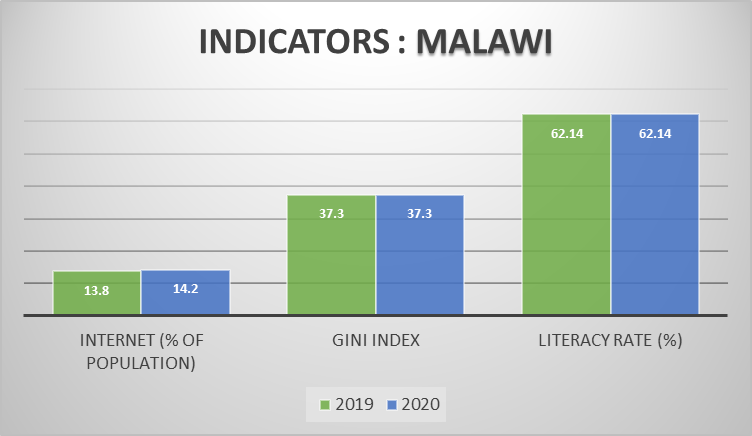
MALAWI
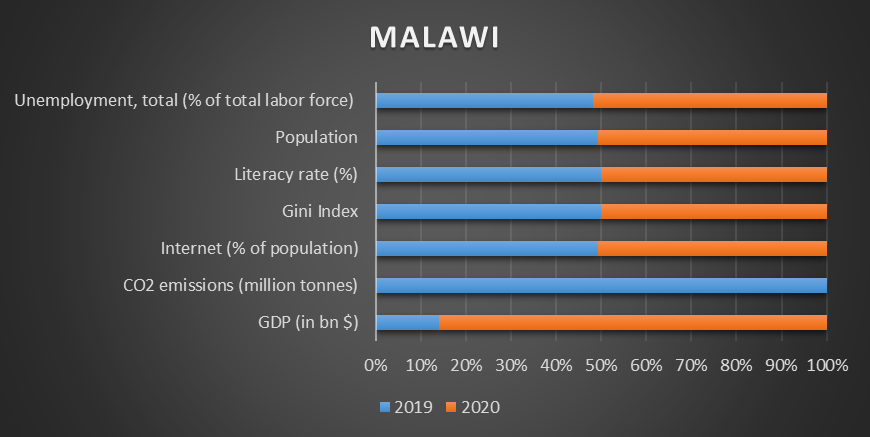
Wholesale, retail, transport, and accommodation services were the worst hit in Malawi during the pandemic time. Education was also affected due to the sudden closure of schools and the country also didn’t witness any migration or increase in the internet user percentage.
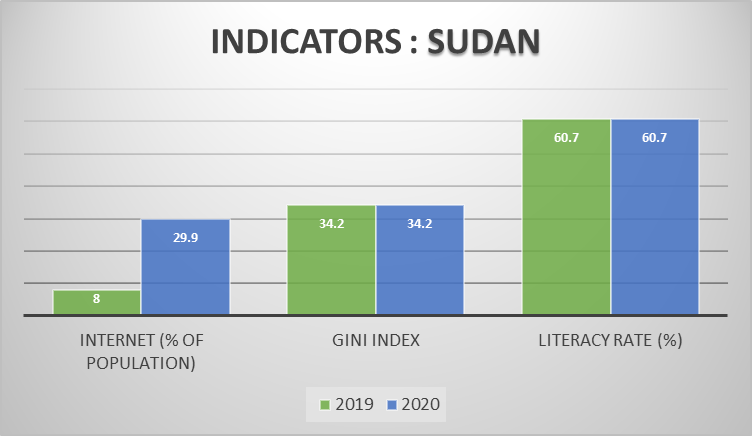
SUDAN
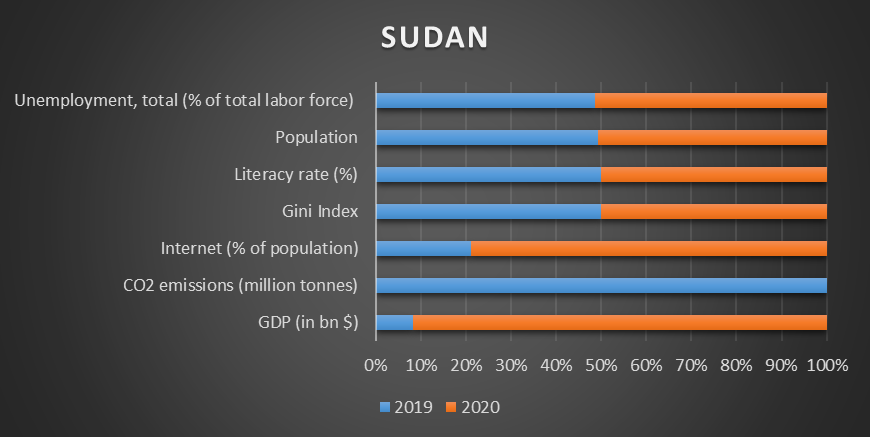
Sudan government took measures to respond to the rise in Covid cases during March, with travel restrictions, closure of schools, lockdown, etc… 2020 had witnessed almost 3 times increase in internet users in Sudan. The enterprise survey results have shown heavy losses witnessed by them. There was inflation affecting the retail market. Family production units were also heavily affected by the crisis. About one-third of households were unable to perform normal farming activities during the outbreak. A substantial share of households experienced an income loss.
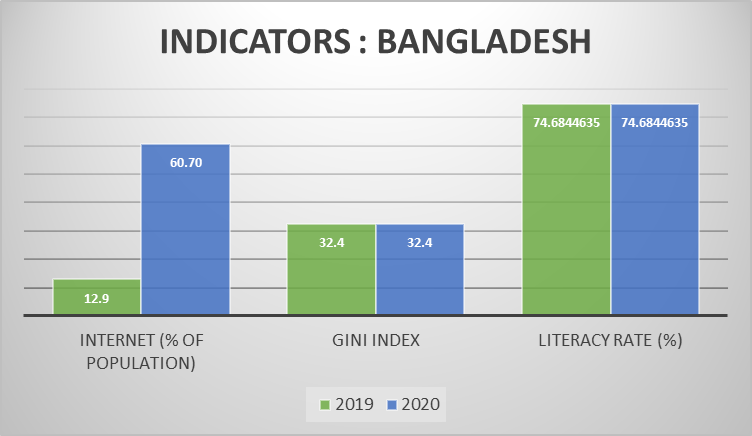
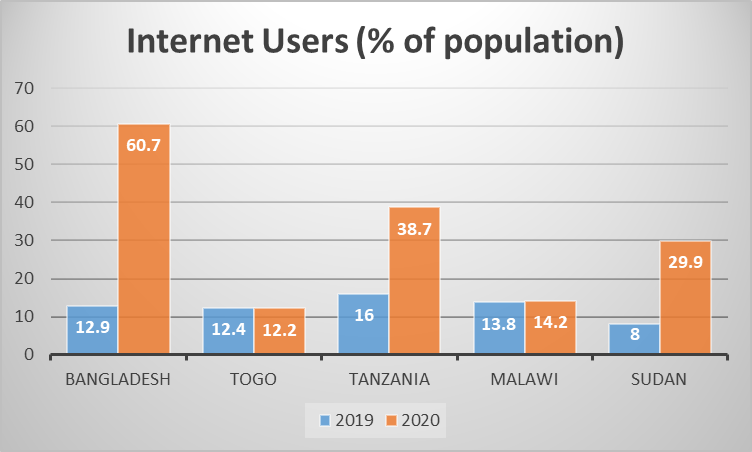
INTERNET USERS
Perhaps, due to lockdown leading to work from mechanisms and E-learning, countries like Bangladesh, Tanzania, Sudan have witnessed an increase in internet users during 2020.
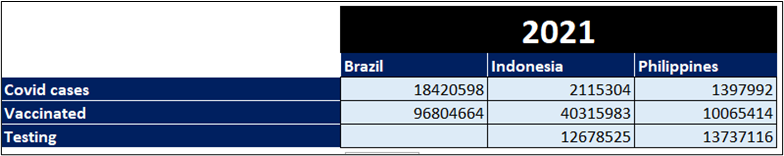
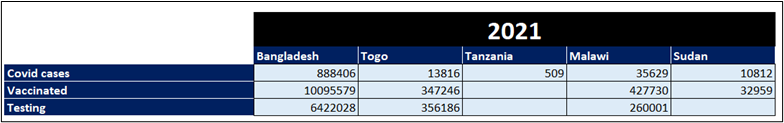
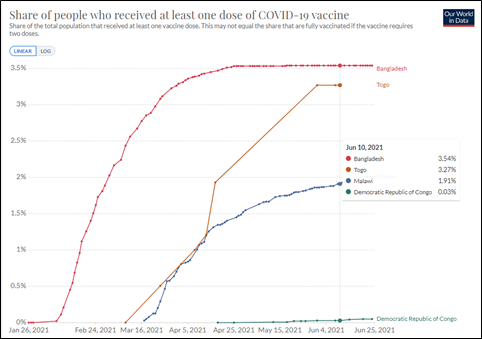
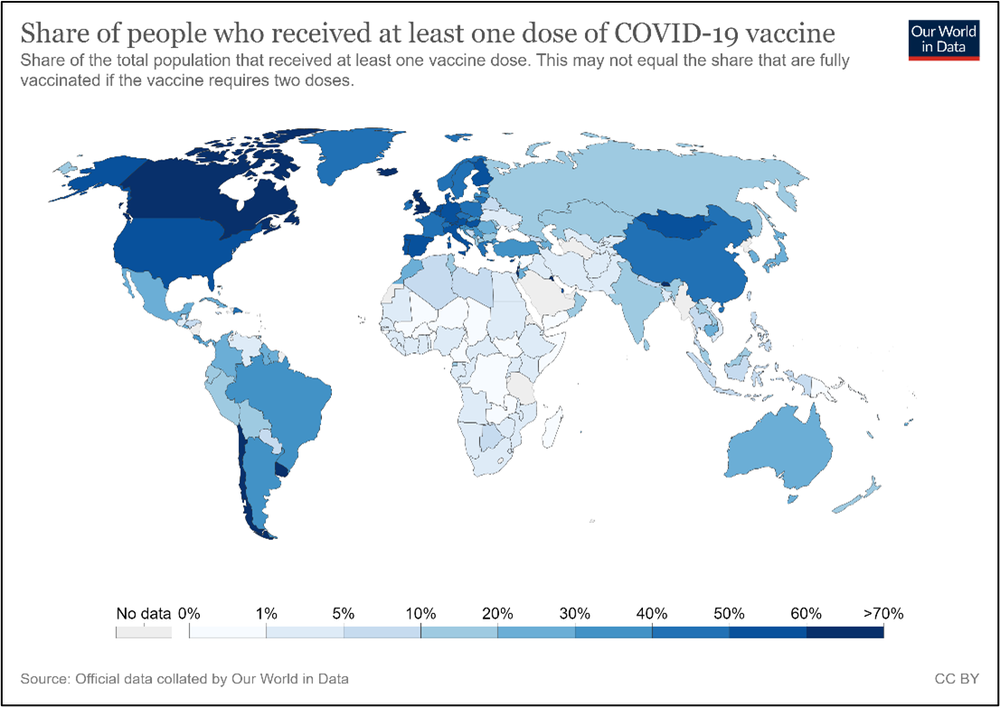
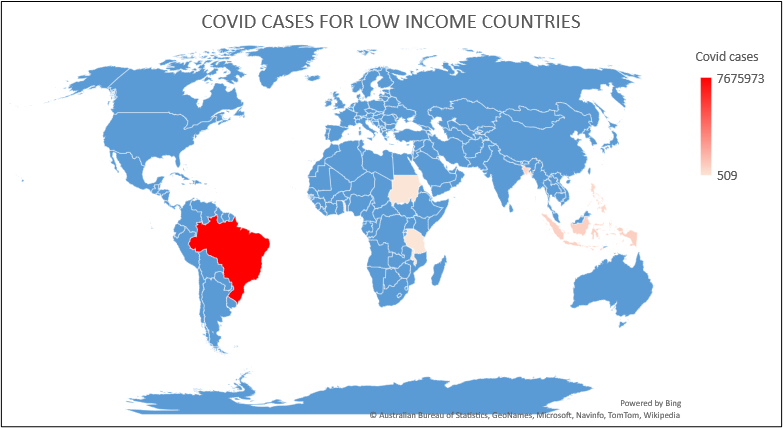
The following is the data of Covid Cases, Testing, and Vaccination throughout the World.
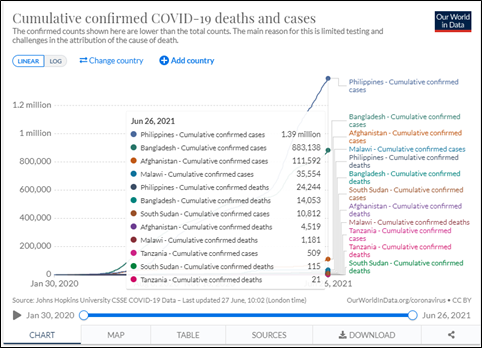
For the Low-Income Countries, the covid cases recorded have been displayed via the heatmap for 2020 as follows:

CHALLENGES:
1. Many countries don’t have the facilities to acquire and publish data regarding covid 19. We could ascertain that countries like Tanzania have stopped publishing the covid cases, testing results during May 2020. The published reports also state that these countries have not been able to purchase the vaccines due to affordability issues.
2. We could also note that there were no accurate published reports of CO2 emissions to compare the mobility data with this indicator. Through this data, we wanted to ascertain if the lockdown in those countries helped curtail greenhouse gas emissions.
3. We wanted to analyze the impact on few tribal regions like
a. Mentawai Islands (Tribes)
b. Palawan- Tribes
c. Vale do Javari
However, these tribes are a part of bigger countries like Brazil, Indonesia, and the Philippines. The data obtained for the country as a whole is not representative of this particular region, as these regions are marked low income, while the country is faring well.