A Comparative Analysis

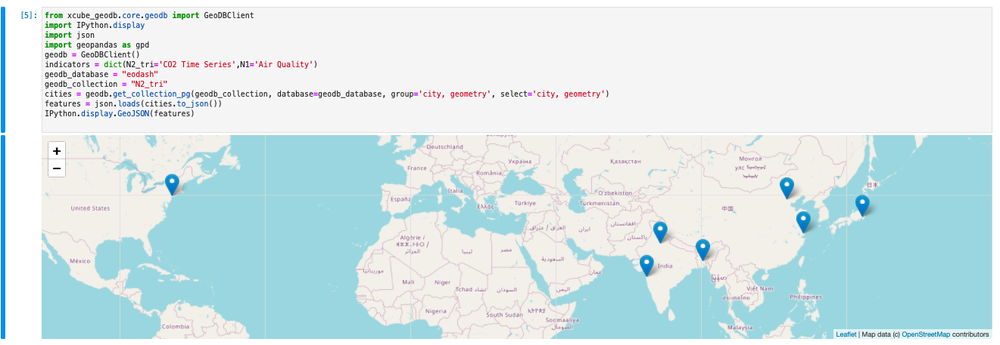
The COVID-19 pandemic has had different impacts in different regions of the world. Your challenge is to perform a comparative analysis of the pandemic’s economic impacts in urban areas for the USA, Asia, and Europe using the EO Dashboard.

IEC-19 (Impact on Economy due to COVID 19)

Summary

It attempts to link the air quality of a region to the economic activity of that region both before and during the COVID 19 pandemic to understand the region’s contribution to the global economy, compare this aforementioned region to other selected regions in the world, and thus interpret the health of the world economy, using various proxies acquired from satellites like Sentinel 5P.

How I Addressed This Challenge

The challenge is to understand the impact on the economy and to try to compare its growth/decline in different regions to the physical phenomena observed by various satellites orbiting our planet. Most environmental changes occur due to business activities , therefore, we have used Air Quality indicators and Mobility patterns in different countries, as proxies of primary, secondary and tertiary industrial activities that tend to contribute a major portion of guaranteed, productive, and mostly sustainable economic activity to the global economy. Our aim is to be able to predict future economic upheavals based off environmental patterns and thus be able to mitigate any possible shortcomings.

How I Developed This Project

What inspired us to choose this challenge was the fact that it was about analysing the economic impact on a region with respect to its air quality.


These days, with the COVID 19 pandemic in full swing in many parts of the world, it has been observed that environmental pollution in most regions has dropped. This corresponds with the decrease in productive economic activity in most parts of the world, due to COVID 19 restrictions such as lockdowns and social distancing measures enforced by many governments.


Which was exactly what most of us had observed during 2020.

How I Used Space Agency Data in This Project

We mainly collected data from the Sentinel 5P satellite (operated by ESA as part of the Copernicus program).

The data gathered from the satellite is

CO2 concentration : used to determine the levels of CO2 emitted,

CO2 time lapse: used to determine changes in CO2 levels over time,

Trophospheric NO2 concentration: used to determine levels of NO2 in atmosphere, an indication of lower air quality if present in high quantities,

Mobility data: used to determine patterns of movement of people around main economic centres in cities ( like mall parking lots),

Activity(cars/container): used to determine the number of cars/containers.

Earth Observing Dashboard Integration


Here is a small snippet of our code and its output:


Data & Resources

[1]EuroDataCube - for Jupyter notebook resources ( and to understand example programs)

[2]Earth Observing Dashboard - for all the types of data gathered by satellites

[3]LucidChart - for creating the given flowchart

[4]Google Slides - to create the given presentation

[5] EODashboard Hackathon Resources - to understand how to create the project using the given guides

Tags

#airquality, #economicimpact,#mobility-patterns

Judging

This project has been submitted for consideration during the Judging process.