Urban Societal Behavior Patterns During COVID-19

The COVID-19 pandemic is currently bringing unprecedented impacts to every aspect of human life. Your challenge is to better understand societal trends in response to COVID-19 through the analysis of remote sensing data and products.

Gateway to Development

Summary

Our project aims at bringing up and supporting people in countries of the world, which are greatly impacted by covid 19. Gateway to Development is a platform, that has the goal of supporting people to learn and upgrade their skills to get employment opportunities with a goal to bring the world together, where people volunteer to teach skills to those in need.

How I Addressed This Challenge

Gateway to Development


Our project is a website called ‘Gateway to Development’ with a goal of helping people especially those in underdeveloped countries, who have lost their jobs in this unprecedented time to develop and upgrade skills without spending a penny. Unemployment causes workers to suffer financially which has an impact on families, relationships and communities leading to a recession or even depression if not addressed in time. This platform will help these people to connect with skilled professionals around the world, who volunteer to come up and share their time, knowledge and experiences with those in need. 


The site provides a free membership where people can sign up and select from the list of skills they would like to learn including new languages, technology, business ideas etc. These ideas will be shared by volunteers who would sign up as ‘Volunteers’ specifying the number of hours they can dedicate and the skills they would like to share. 


Learning new skills will give people the opportunity to find jobs and financially bring up their family, thier society and their country as a whole. It has a positive impact on the global economy. 

How I Developed This Project

What inspired our team to choose this challenge


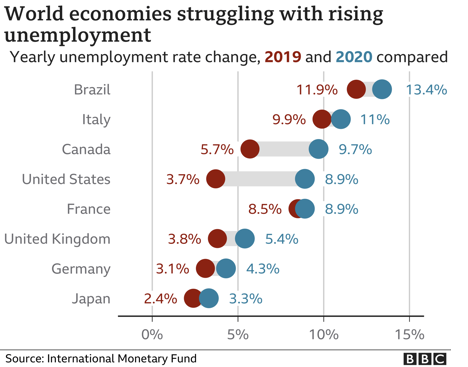
Covid 19 has had a disastrous effect on the global economy and so it seemed best to choose Gateway to Development as our solution to this challenge, where the world comes together to help and support people and nations that have been economically hit by the effects of Covid 19. 


What was our approach to developing this project


We laid down a step-by-step plan, had a well-defined scope to create and develop our site, taking into account the complexities it may have and the goals it aims to achieve. 


What tools, coding languages, hardware, software did we use


We used visual and HTML editing tools on a website developing application making it easy for people to understand and use. We also used various social media platforms to create awareness among people in need, and volunteers willing to help. 


What problems and achievements did our team have


Since we wanted a blend of quality standards and also a website easy to navigate, we had to come up with ideas keeping pace with data privacy, innovation, consistency, To provide a seamless experience to both our users and volunteers. This was challenging, but working as a team and having a great team spirit with a common goal helped us develop it. 

How I Used Space Agency Data in This Project

How we used the EO Dashboard


Showdown and recovery proxy maps of the EO dashboard indicate how so many businesses were impacted because if the pandemic, not only in the rural but also in developed urban areas. The demand of jobs exceeded the supply. There was an increase in a workforce who are seeking jobs, but are unable to find and also people who are working, but do not have appropriate jobs, and are not to meet their financial requirements. Unemployment is one of the major indicators of the country’s economic status. 


The above screenshot from the eo dashboard shows how a city in India has effects of Covid 19 on its business houses, and the blue shaded areas underline how the recovery is slow. 


Other Open Source


Another reference from an open source illustrates the economy struggling with rising unemployment. 


Earth Observing Dashboard Integration

how our solution could be integrated into the Earth Observing Dashboard


Our project will provide links that can be integrated on the EO dashboard for people to stay connected, anywhere and at all times. It will help to combine and share data, which can be easily accessible through the dashboard. It will engage and motivate people viewing the dashboard to understand the impact and volunteer to help and support those in need. Visibility of seeing the economy improve is a driving force for the world to come together in this unprecedented times. 

Data & Resources

Reference Links


https://eodashboard.org/

https://www.bbc.com/news/business-51706225

https://www.canva.com/


How the data was used


We used these links to gather information about covid 19


We used Canva to make our presentation


Tags

#economicimpact

Judging

This project has been submitted for consideration during the Judging process.