The COVID-19 pandemic is currently bringing unprecedented impacts to every aspect of human life. Our challenge is to better understand societal trends in response to COVID-19 through the analysis of remote sensing data and products.
SPM, RPM, Mobility Trends, and CO2 all indicators that are helping us to get ideas about the economy and the changes. But we want to get proper knowledge about the global market. So, we have tried to find out anything that relates to the market. We have mainly tried to find a new indicator and develop an existing indicator.
The economy of a country depends on agricultural, industrial, and service sectors. By using H2SO4 we can get a better idea about the working areas in agriculture and the industrial sector. CO2 Indicators can’t describe the economic sectors properly. It describes the climate changes. SPM/RPM uses 3d works, Echo, and SONAR technology. But it can only show the density of people, cars, shipping, and constructions. The same goes for Mobility Trends. It uses the phone’s GPS technology. It mainly works to describe the situation of service sectors. But, our new indicator- using the rate of H2SO4- can relate to the global economy and describe the proper scenario of the economy. Besides, we can observe the rate of deforestation by SPM/RPM. That's how we can get a better idea about the wood products manufacturing market.
Sulfuric Acid: Sulfuric acid is also used as a reactant during the manufacture or processing of certain goods. Here are some examples of its function:
- To remove impurities during petroleum refining;
- To remove metallic oxides before electroplating and galvanizing metal;
- To remove water during certain chemical reactions;
- To act as a reactant in the manufacture of rayon and nitro-glycerine;
The sulfuric acid market is segmented into:
- Fertilizers
- Pulp & Paper
- Textiles
- Chemical Manufacturing
- Metal Processing
- Automotive Battery Acid
- Petroleum Refining
- Others
Since the COVID-19 virus outbreak in December 2019, the disease has spread to almost 200 countries around the globe with the World Health Organization declaring it a public health emergency. The global impacts of the coronavirus disease 2019 (COVID-19) are already starting to be felt and will significantly affect the Ultra-Pure Sulfuric Acid market in 2020.
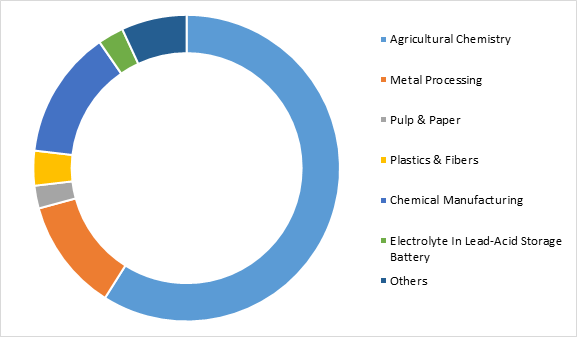
Figure-1: sulfuric acid marketing revenue
Week demand from the following industries:
- Copper
- Automobile
- Refining sectors
- Automotive
Strong areas:
- Agriculture
- Water treatment
- Paper industries
- Chemical manufacturing
Here we can see that in this pandemic copper, automotive, automobile, and refining sectors have reduced their use of H2SO4. So, this COVID 19 has a bad impact on some major construction sites.
On the other hand, H2SO4 is being used much in agriculture(fertilizer), water treatment, paper industries, and chemical manufacturing sites. So, we can understand that COVID 19 has no bad effects on these sides
Wood extraction: Wood is one of the raw materials of the industrial sector. As a material, wood has been in service since humans appeared on Earth. Today, despite technological advancement and competition from metals, plastics, cement, and other materials, wood maintains a place in most of its traditional roles, and its serviceability is expanding through new uses. In addition to well-known products such as lumber, furniture, and plywood, wood is the raw material for wood-based panels, pulp and paper, and many chemical products. Finally, wood is still an important fuel in much of the world.
On a weight basis, the consumption of wood exceeds by far that of other materials. More than half of Round wood (log) production is consumed as fuel, mainly in less-developed countries. Production of paper and paperboard has shown the most rapid increase among wood products; this trend is expected to continue as consumption per person in the less-developed countries approaches that in the developed nations. The rising world population is the driving force of increasing consumption of wood and consequent deforestation.
The outbreak of Coronavirus disease (COVID-19) has acted as a massive restraint on the wood products manufacturing market in 2020 as supply chains were disrupted due to trade restrictions and consumption declined due to lockdowns imposed by governments globally.
The outbreak of Coronavirus disease (COVID-19) has acted as a massive restraint on the wood products manufacturing market in 2020 as supply chains were disrupted due to trade restrictions and consumption declined due to lockdowns imposed by governments globally.

Figure-2: deforestation rate
In the graph, we can observe that there was a decrease in wood production in the first quarter of 2020, which is the period when Covid-19 began to spread globally. It refers to the great impact of covid-19 in the wood products industry. But later on, it started recovering again.
https://drive.google.com/file/d/1-58Vm_cHhipd67eS61tJn5QKtQrywQC9/view?usp=drivesdk