Used to cross-check economic indicators. We found the following.
(1)Beijing, Greenhouse Gases(Beijing_AIR data)
https://eodashboard.org/?country=CN&poi=CN01-N2
Of course, it is linked to air pollution in Tokyo.
(correlation coefficient:.718**, ** p < .01)
This is related to non-ferrous metal smelting and refining industry(very useful indicators).
(correlation coefficient.682**, ** p < .01)
(2)Beijing, Activity (cars/containers, Beijing_CAR data)
https://eodashboard.org/?country=CN&poi=CN03-E9
This data is represents China's manufacturing activity
【electricity consumption of manufacturing 2020 (correlation coefficient:.907**, ** p < .01) )】,
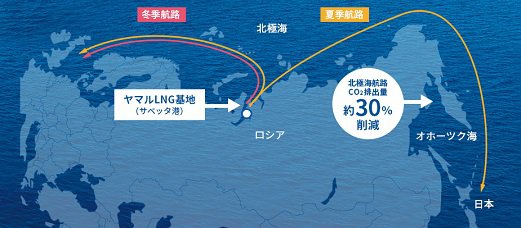
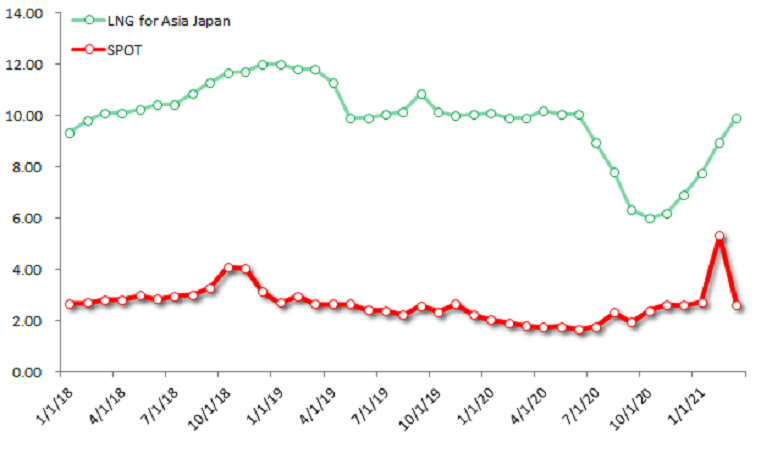
so, it is related to the price of LNG for Asia Japan.
(correlation coefficient:.506+, + p < .10)
Interestingly, The car data in Nagoya and in Beijing are moving in the opposite direction.
(correlation coefficient:-.694**, ** p < .01)
It is thought that Beijing represents the movement of the Chinese market, while the data of Nagoya represents the global demand for cars.
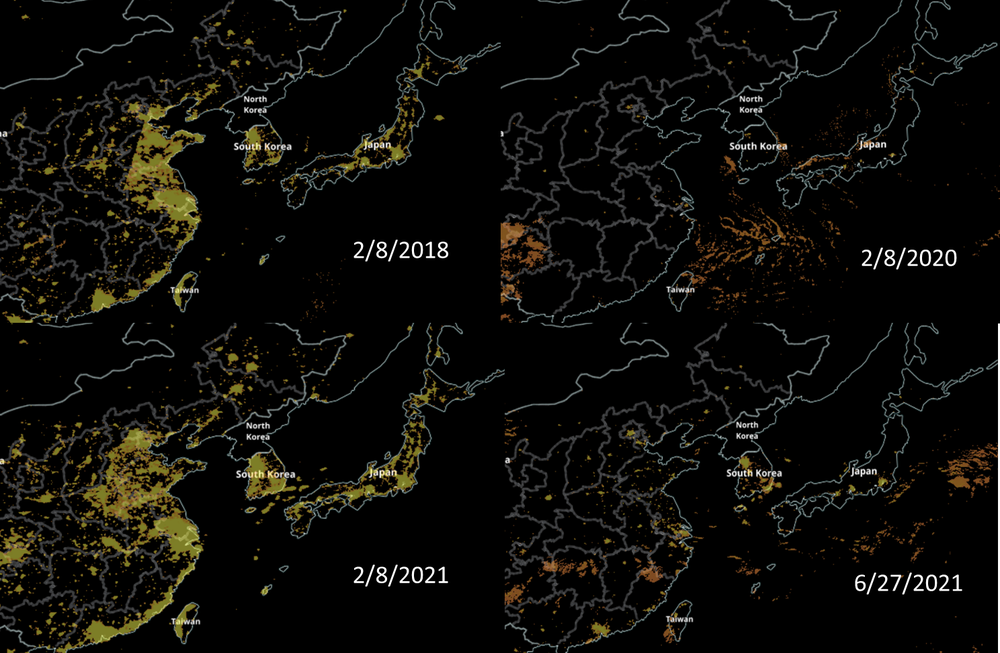
(3)Tokyo, Greenhouse Gases(Tokyo Air data)
https://eodashboard.org/?country=JP&poi=JP01-N2
it is linked to air pollution in Beijing.
(correlation coefficient:.718**, ** p < .01)
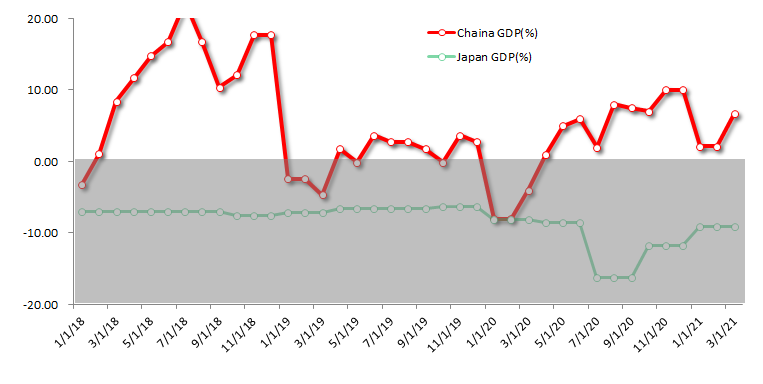
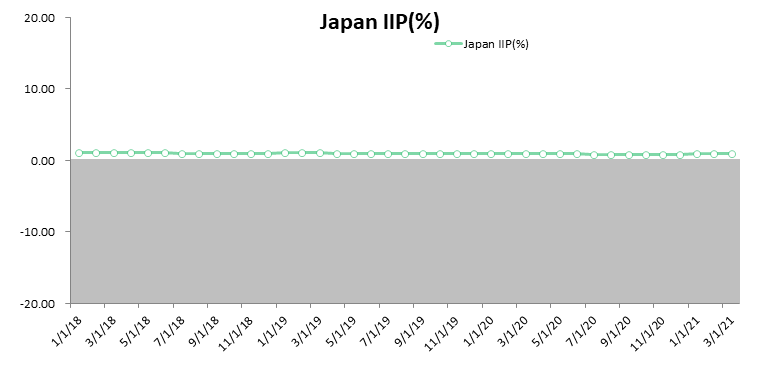
It is also linked to Japanese economic activity(GDP).
(correlation coefficient:.564*, * p < .05)
(4)Nagoya, Activity (cars/containers ,Nagoya_CAR data)
https://eodashboard.org/?country=JP&poi=JP03-E9
Interestingly, this Nagoya car data are moving to the price of LNG for Asia Japan in the opposite direction.
(correlation coefficient:-.646**, ** p < .01)
We can see that toyota are Export when resources become cheaper(resources etc).