Ship Traffic and the Impact on Air Quality

The COVID-19 pandemic strongly affected global logistics and supply chains, and hence shipping activity. This challenge asks you to target the characterization of dynamic shipping activities as seen from space.

Effects of Traffic Jam

Summary

History has observed huge traffic jams across land, water, air and they create a gigantic impact on the Economy, Air pollution, Water Pollution, and loiter of time. The impact of such congestion will last long in climate and create havoc in the location. One of such problems was the incident at Suez Canal where a large container ship ran aground and blocked the canal traffic leading to huge losses and impacting the air quality around the areas.

How I Addressed This Challenge


  1. Extract the air quality indexes from NASA's Earth Observatory & ESA's Sentinel 5P TROPOMI Data sources for a consecutive period involving in and around the ship blocking incident.
  2. Finding the cause of the incident, the number of ships that were stranded, other vessels in the salvage operations, and calculating the average emissions with reference to standard ship emission values.
  3. Accessing the pattern of stranded ships by using NASA's Landsat8 OLI.
  4. Referring to various articles published to calculate the economic losses.
How I Developed This Project

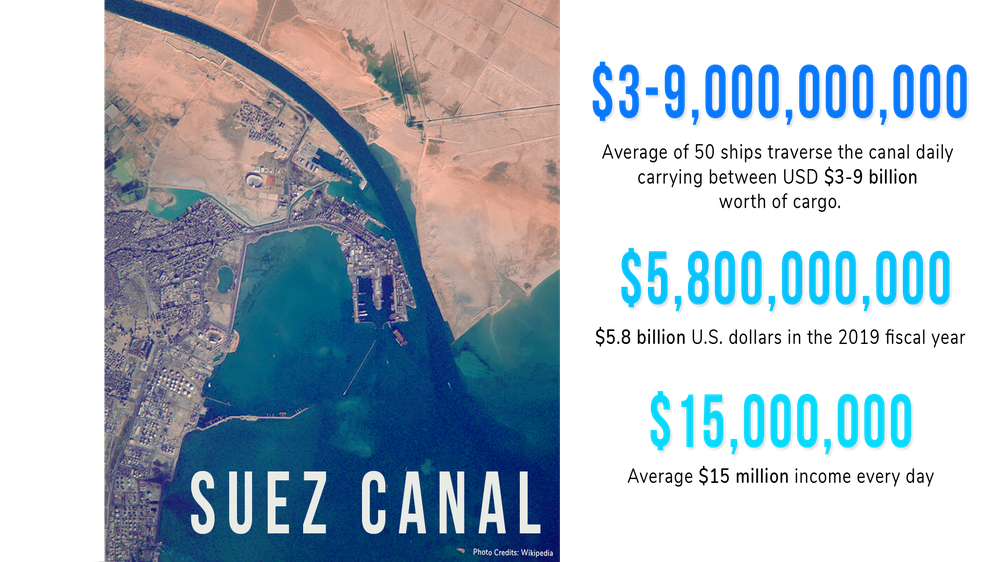
The Suez Canal is an artificial sea-level waterway in Egypt connecting the Mediterranean Sea to the Red Sea and mostly Europe and Asia. It is an unlocked canal with a length of 193kms (633202ft) and width of 205mtr (673ft) along with a depth of 24mtr (79ft). The waterway starts from Port Said in the northern end and Port Tewfik in the southern end.

This canal has led to the reduction in travel time of ships between the Arabian and Mediterranean sea by 8 to 10days. And this has led to the increase in economic profits by cutting fuel usage, saving time, and decreasing emissions of gases leading to pollution.


The normal ship traffic in the Suez Canal is 97ships/day. During the pandemic time 2020, the traffic was reduced to 50ships/day.

That was 18500 ships.


It takes 12 to 16hrs to transit the canal.

Ships have to travel in a convoy. One Northbound and two southbound.

Only north movement is allowed in a single run without stops, which means southbound ships have to wait for clearance. This will lead to increased emission of pollutants by waiting for ships. Passage of ships starts at 4 am from both sides. The canal should be passed only at times between 11 am and 4 pm at speeds of 8 knots (9mph/15 km hr). 


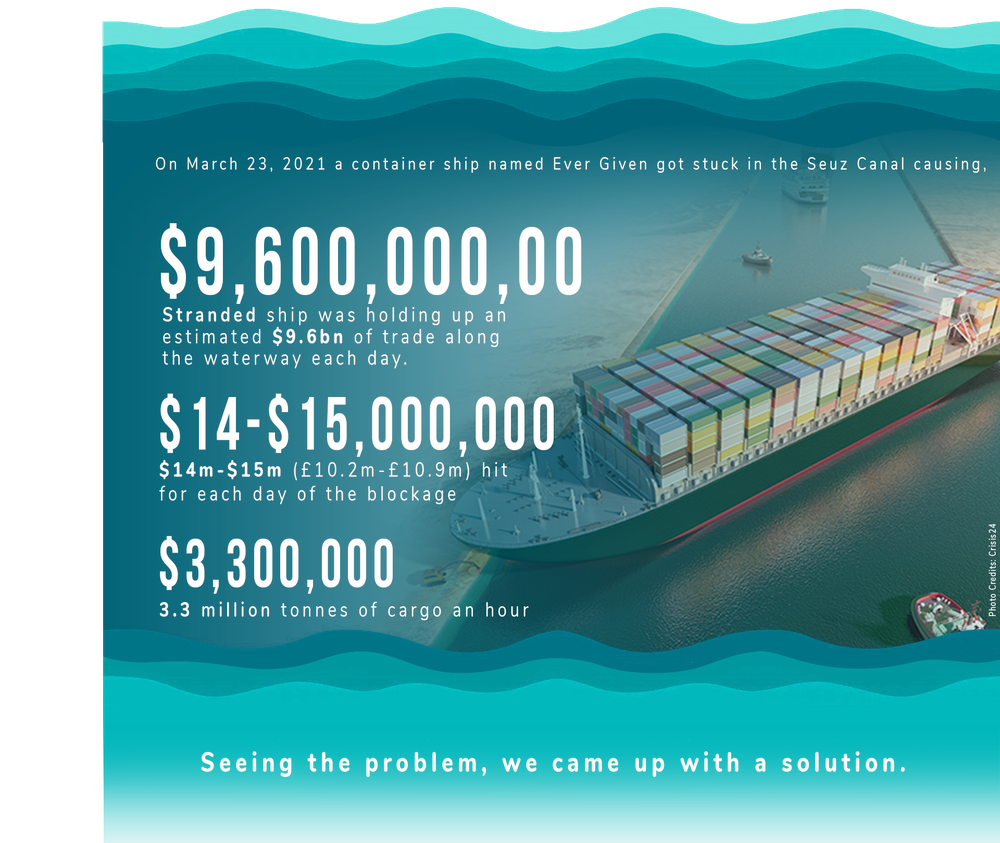
Suez blockage Incident:

Date- 23-03-21   7.40pm Local

Ship- Ever Given operated by Evergreen Marine, Taiwan

Journey- Malaysia to the Netherlands

Rescued on- 29-03-21  15.05 Local


The ship drifted and got stuck in the canal causing a huge traffic jam. The cause is wind knocking off the ship. On the initial days, the no. of ships stuck behind was 369. The wind speed recorded was 40knots when the ship struck the banks. 14 tugboats were used along with bulldozers for dredging. The blockage was cleared on 29-03-2021 and at that time the backlog ship count was 450. Suez was only fully operable by 2-04-2021.


Methods of Observation

  •  Before the event NO2 levels were low at the entrance of the Suez canal and also the NO2 levels on land were low when compared to the values on the sea. 
  •  At the time of the event, NO2 levels were moderate across the study area because at the time the ship engines were running and various equipments were used for dredging. 
  •  After the event, it was clearly visible that a major section of the study area has identified low NO2 levels. The NO2 values were also moderate at sea.
How I Used Space Agency Data in This Project

1. Tropospheric NO2 data from Sentinel-5P Tropospheric column NO2 data from the predecessor Sentinel 5P Tropospheric Monitoring Instrument (TROPOMI) is used for the study.


2. The Data is extracted using Google Earth Engine, where 6 days averaged maps are created for the study area in 3 sets, i.e. before the incident (17 March - 22 March), At the time of incident (23 March - 29 March), and After the incident (30 March - 4 April).


3. The Data is further processed using ArcGIS Pro for clear visualization.

Project Demo

Presentation

https://drive.google.com/file/d/1HSErcjr9QI8LGwQlkVmIuCMIRFH63lx1/view?usp=sharing


Implementations


  1. Setting Standards- Categorizing ships that traverse a particular region according to the type of carriage, fuel, gross weight, dimensions, etc. and allow accordingly the movements.
  2. Effective Passage- Widening and deepening the canals and other narrow channels, if possible, construct double lanes or parallel waterways.
  3. Remote Sensing- Designing an early warning system to alert ships when there is an accident or overloading in an area by integrating Ship Reporting System (S-AIS), Meteorological System (NOAA) and Earth Observatory System (EOS), thereby scattering the ships or by holding them in a convoy, thus reducing pollution over a concentrated area.
  4. Voyage Optimization- Planning routes according to ocean currents, less travel distance and Slow Steaming (A method of reducing speeds at High Sea)
  5. Auxiliary Power- Turning off main engines and using alternate electrical power provided by the berths when the ship is stationed at the Port, thereby reducing emissions.
  6. 2020 Sulphur Cap- Switching to low sulphur content fuel. Fuel with sulphur not more than 0.5%.
  7. Long term factor- Improving the ship hull designs which will reduce drag and chances of getting stuck in narrow canals.
  8. Conventional Resources- Using wind-assisted propulsion, solar panels, lithium batteries on the ship for electrical needs.
  9. Exchange system- Implementing a method i.e. exchanging empty containers for laden containers without returning them, thereby reducing empty haulage of cargo ships.
  10. Compensation- Penalty system for not adhering to the safe and eco-friendly navigation through the waterways and oceans.
Earth Observing Dashboard Integration

Economic effects of Traffic Jams


  • Determining the loss per hour due to the congestion in the specific area to the authorities and to the ships.

Increase in Pollution levels


  • Amount of increased NO2 and SO2 concentrations and their effect on the surrounding regions.

Tip to avoid such incidents


  • Advanced Observation Systems with Efficient and Eco-friendly Transportation
Data & Resources

1.https://earthobservatory.nasa.gov/images/148114/traffic-jam-on-the-suez-canal

2.https://www.usatoday.com/in-depth/graphics/2021/03/26/how-evergreens-ship-got-stuck-in-the-suez-canal/7010375002/

3.https://disc.gsfc.nasa.gov/datasets/S5P_L2__NO2____1/summary

4.https://developers.google.com/earth-engine/datasets/catalog/COPERNICUS_S5P_OFFL_L3_NO2?hl=en

5.https://code.earthengine.google.com/23df54c24a678129c8bf7c119e8ab370

6.https://www.mfat.govt.nz/en/trade/mfat-market-reports/market-reports-middle-east/the-importance-of-the-suez-canal-to-global-trade-18-april-2021/

7.https://www.statista.com/statistics/1226385/revenue-of-the-suez-canal-authority/

8.https://www.aa.com.tr/en/economy/suez-crisis-to-trigger-losses-for-egypt-world-trade/2189376

Tags

#suez #evergiven #trafficjam #pollution #economiccrisis

Judging

This project has been submitted for consideration during the Judging process.